

Lesson 7 — Analysis of Variance (ANOVA)


Lesson 7: Analysis of Variance (ANOVA)
The t-test is great for comparing two means. But what happens when you have three, four, or even more groups? Running multiple t-tests increases the chance of false positives (Type I error inflation). The solution is Analysis of Variance (ANOVA) — a powerful method that compares means across multiple groups in one test.
What ANOVA Does
ANOVA tests whether the means of several groups are significantly different from each other. It does this by partitioning (splitting) the total variability in the data into two parts:
- Between-groups variability: Differences caused by the treatment or factor (the effect we care about).
- Within-groups variability: Differences due to random chance or individual differences within each group (error or noise).
If between-groups variability is much larger than within-groups variability, the group means likely differ because of the treatment — not just chance.
The F Ratio — The Heart of ANOVA
The test statistic is the F ratio:
$$ F = \frac{MS_{\text{between}}}{MS_{\text{within}}} $$
In words:
$$ F = \frac{\text{Mean Square Between Groups}}{\text{Mean Square Within Groups}} $$
Where:
- $$ MS_{\text{between}} = \frac{SS_{\text{between}}}{df_{\text{between}}} $$ (variance explained by the groups)
- $$ MS_{\text{within}} = \frac{SS_{\text{within}}}{df_{\text{within}}} $$ (variance due to error)
A large F value suggests the between-groups differences are real, not random.
Degrees of Freedom in One-Way ANOVA
- $$ df_{\text{between}} = k - 1 $$ (k = number of groups)
- $$ df_{\text{within}} = N - k $$ (N = total number of observations)
- $$ df_{\text{total}} = N - 1 $$
Example: One-Way ANOVA
Three groups of students use different study techniques:
- Group A: mean = 70
- Group B: mean = 75
- Group C: mean = 85
Suppose calculations give:
- $$ SS_{\text{between}} = 300 $$, $$ df_{\text{between}} = 2 $$ → $$ MS_{\text{between}} = 150 $$
- $$ SS_{\text{within}} = 200 $$, $$ df_{\text{within}} = 12 $$ → $$ MS_{\text{within}} = 16.7 $$
Then:
$$ F = \frac{150}{16.7} \approx 9.0 $$
Compare F = 9.0 to the critical value from the F-table (df = 2, 12) ≈ 3.89 at p = 0.05. Since 9.0 > 3.89, the result is significant — the study techniques produce different mean scores.
Types of ANOVA
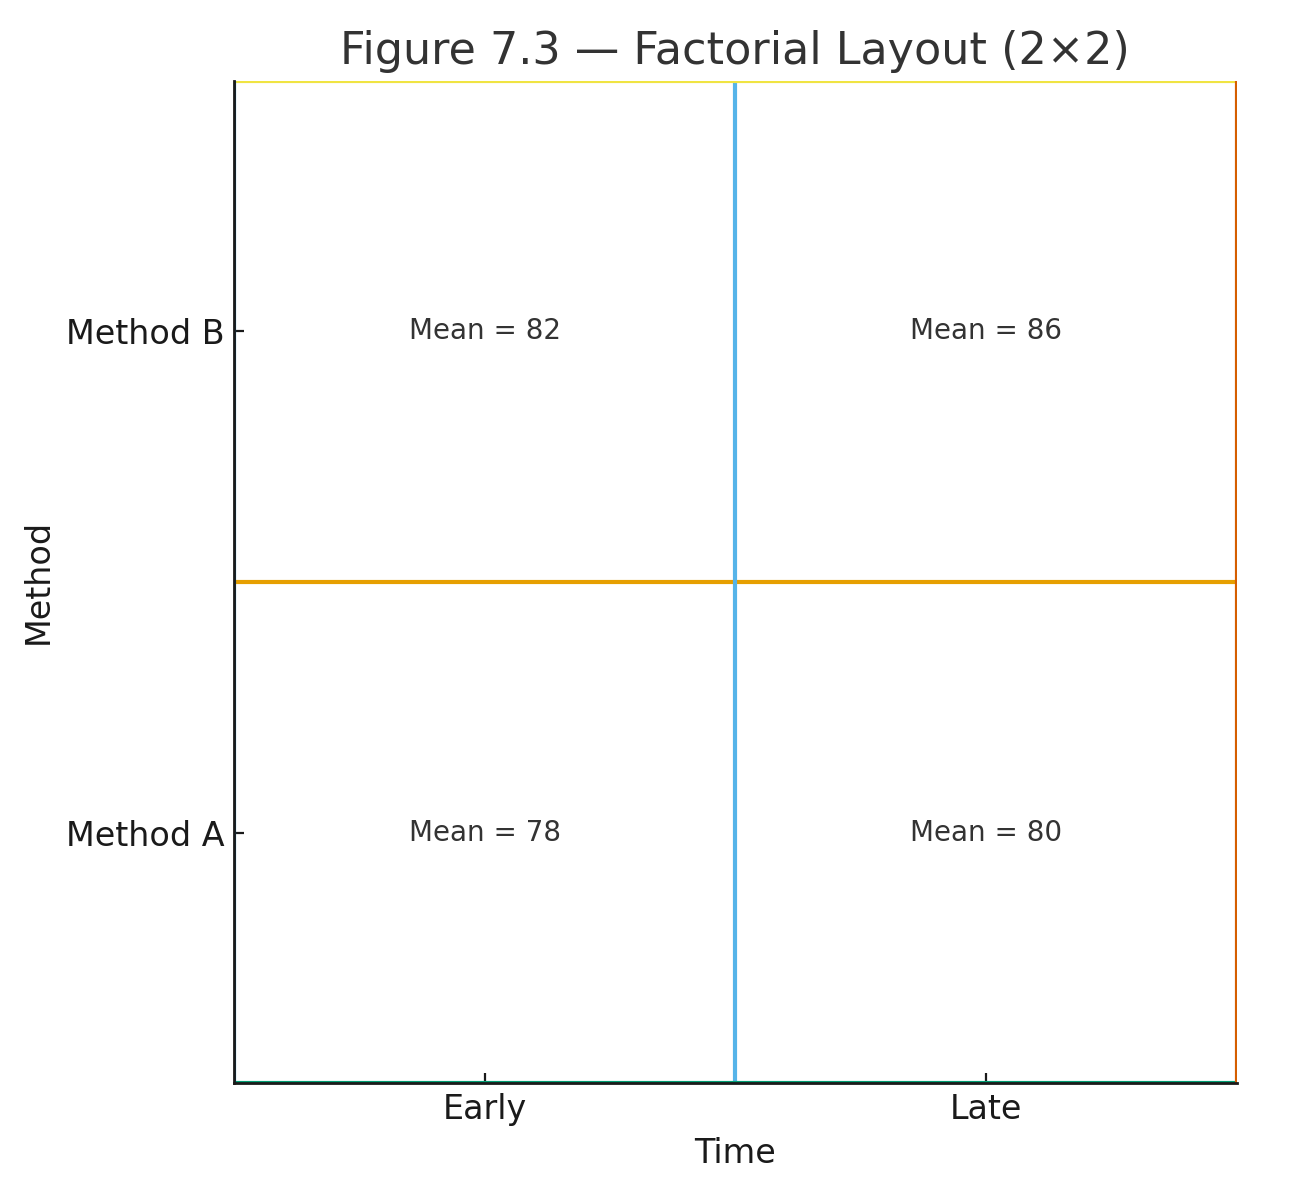
Factorial ANOVA
Tests two or more factors simultaneously (e.g., teaching method × time of day in a 2×2 design). It reveals:
- Main effects of each factor
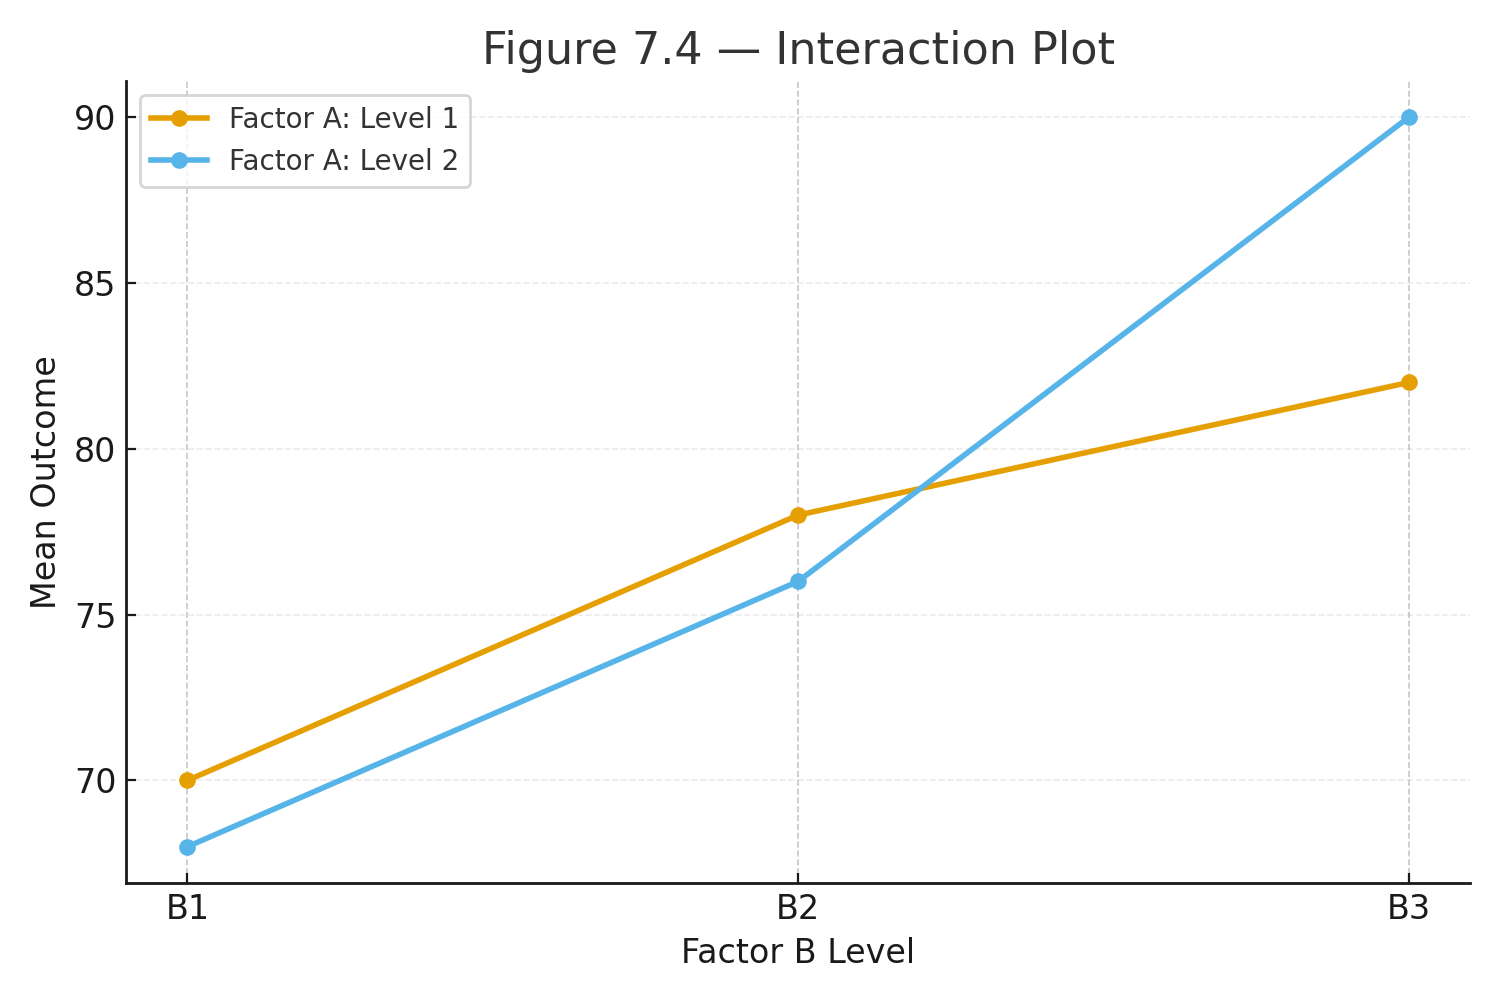
- Interaction effects (when one factor's effect depends on the level of another)
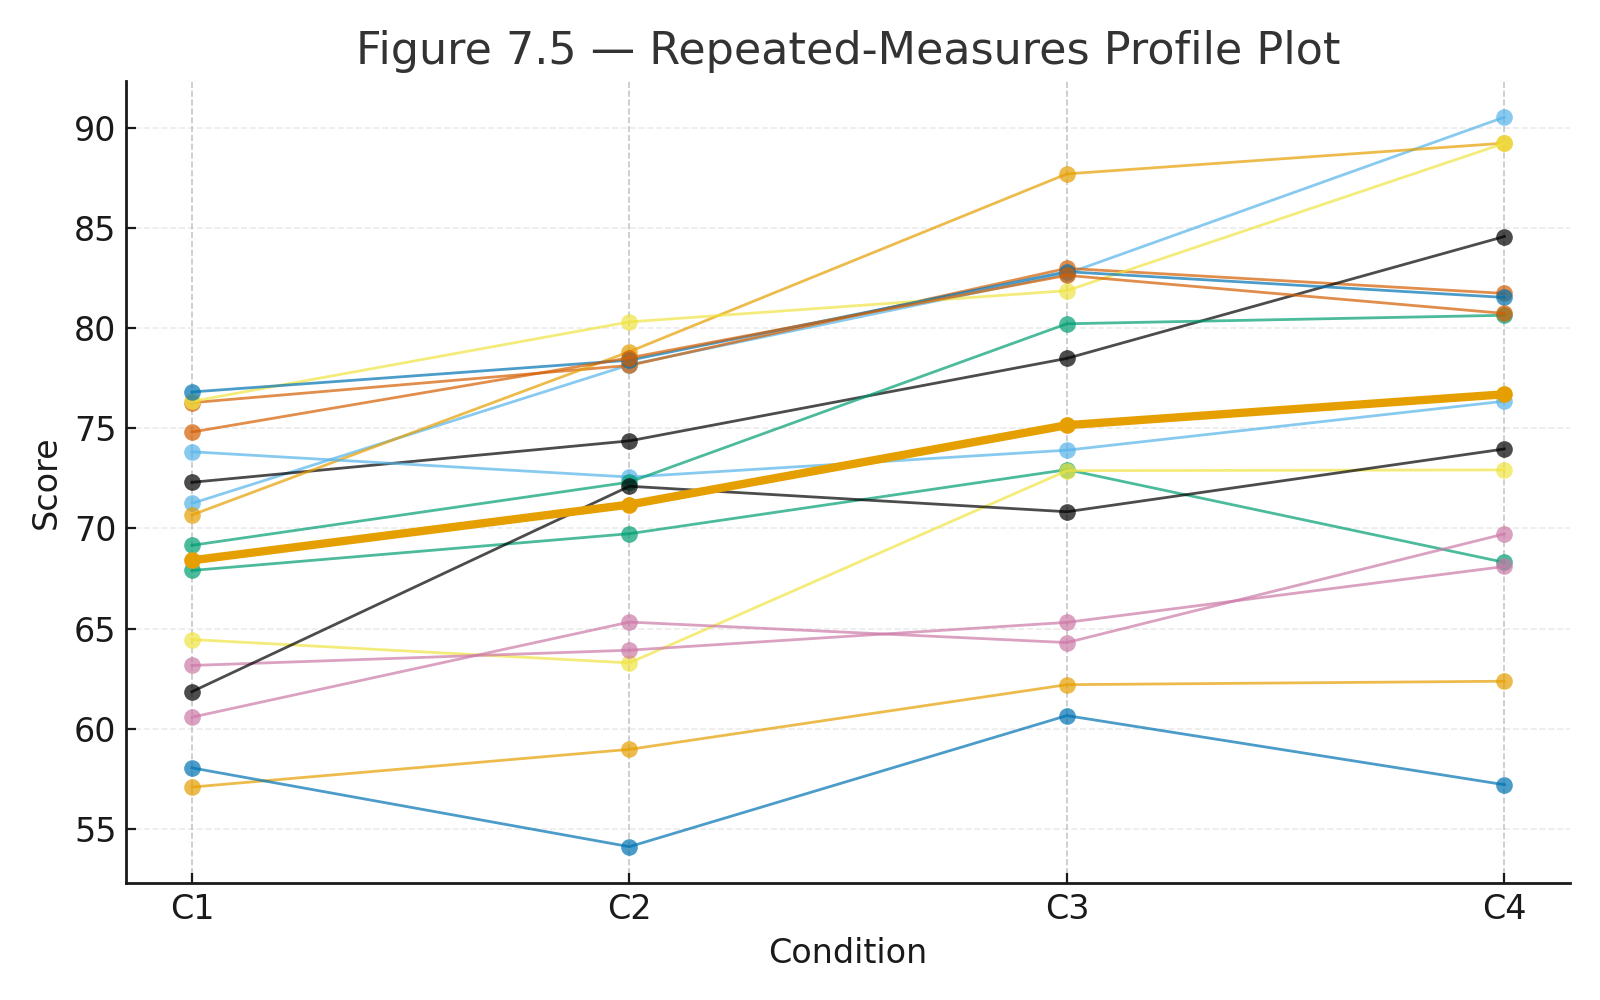
Repeated-Measures ANOVA
Used when the same participants are measured multiple times (e.g., test scores before, during, and after a treatment). Removes individual differences, increasing statistical power.
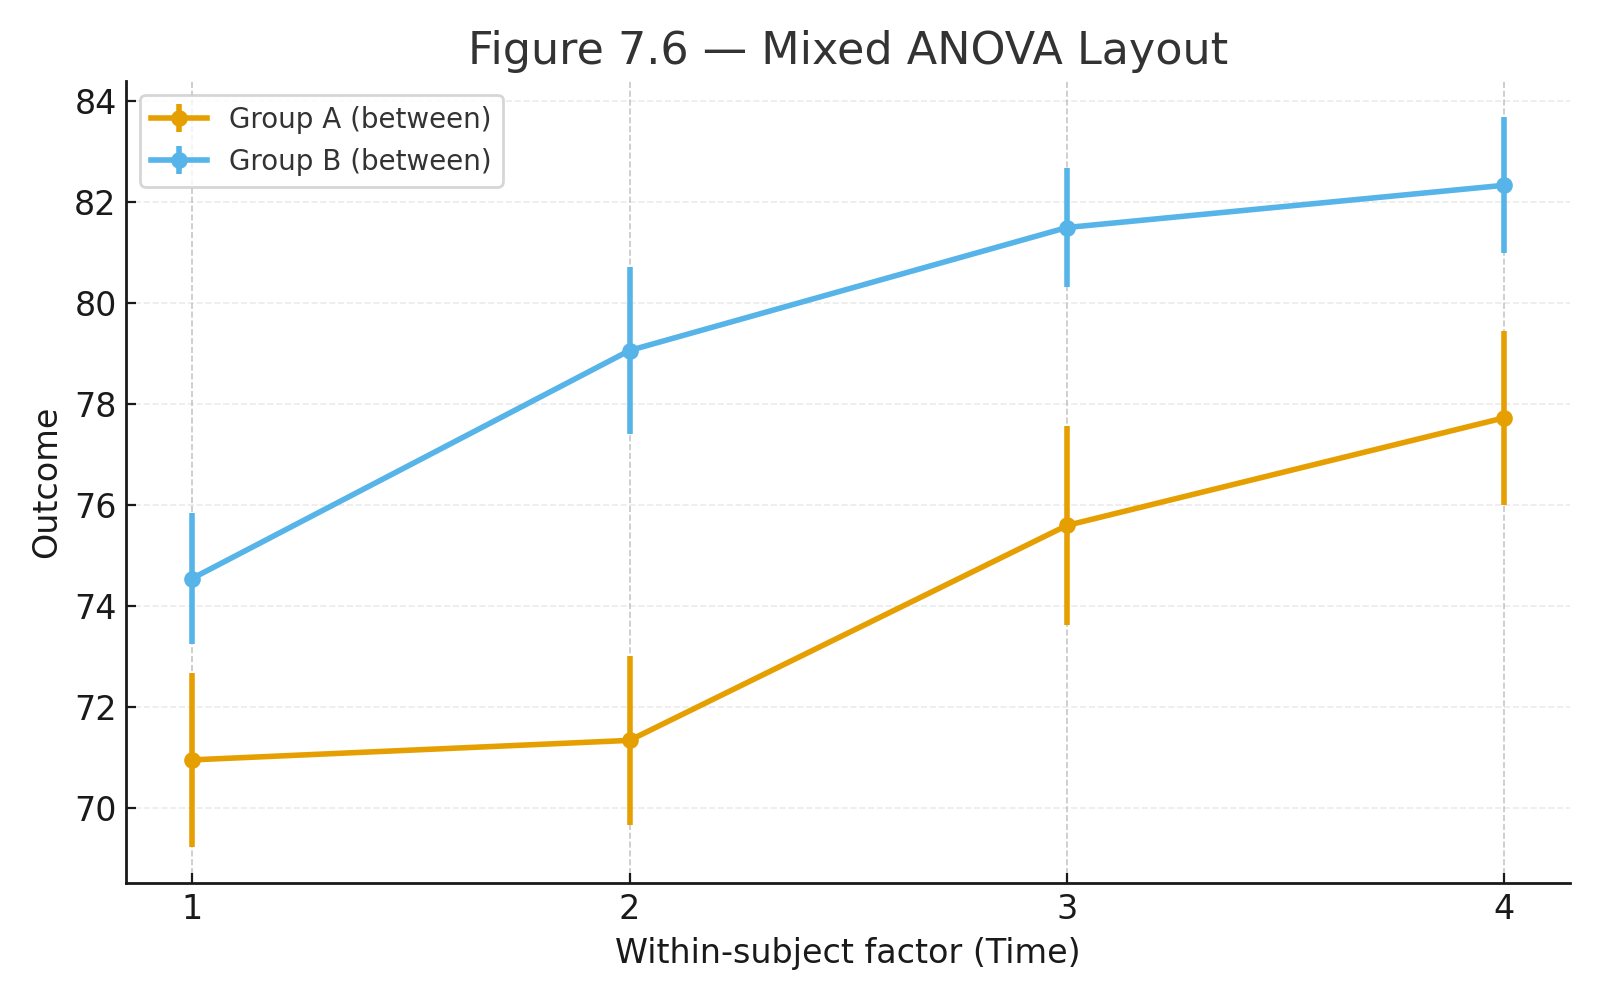
Mixed (Split-Plot) ANOVA
Combines between-subjects (e.g., different treatment groups) and within-subjects (e.g., repeated measures over time) factors. Common in psychology, education, and clinical research.
Quick Summary
- ANOVA generalizes the t-test to 3+ groups.
- F ratio compares explained variance to error variance.
- Large F → likely real differences between groups.
- Types: one-way, factorial, repeated-measures, mixed.
Visuals
Figure 7.1 — One-way ANOVA: Bar chart showing group means with error bars.
Figure 7.2 — Variance partitioning: Total SS split into Between SS and Within SS.
Figure 7.3 — 2×2 Factorial design grid.
Figure 7.4 — Interaction plot: Non-parallel lines indicate interaction.
Figure 7.5 — Repeated-measures profile plot.
Figure 7.6 — Mixed ANOVA structure.
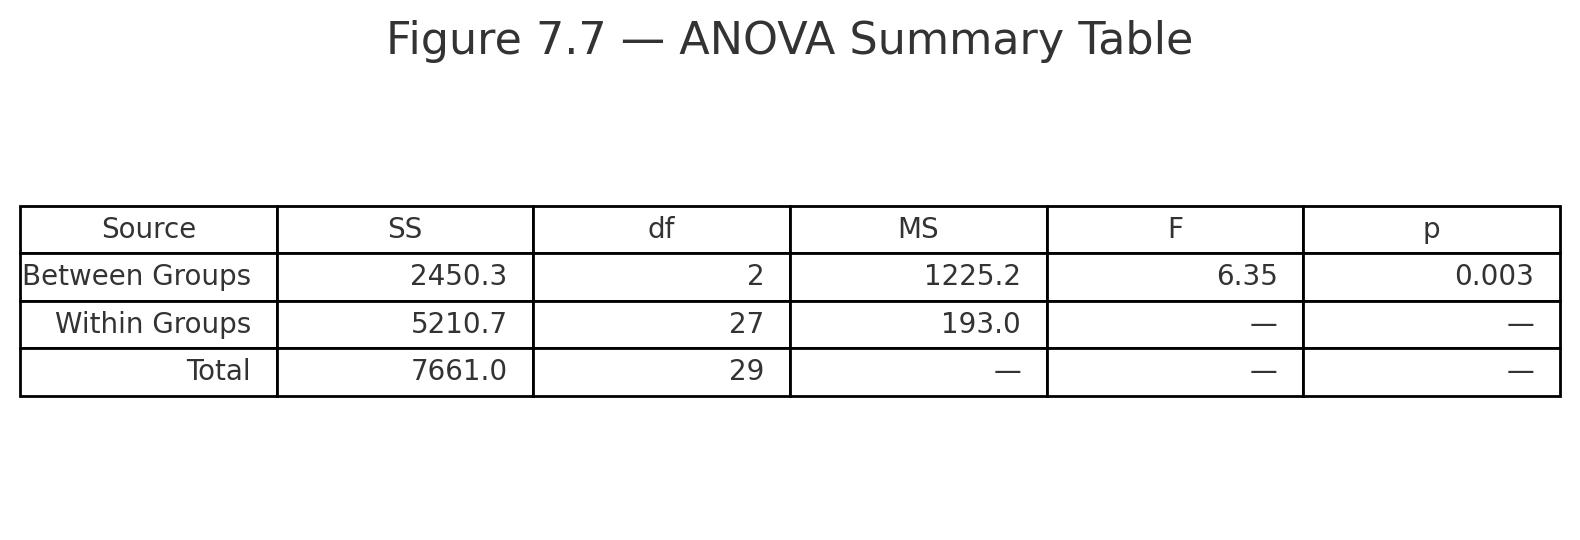
Figure 7.7 — Standard ANOVA summary table (Source | SS | df | MS | F | p).
Why ANOVA Matters
ANOVA is one of the most powerful and widely used tools in science. It helps researchers determine whether differences among groups are meaningful — not just random noise — making it essential for experiments in psychology, education, biology, medicine, and more.
Practice & Self-Test
Try the interactive self-test quiz below to check your understanding of ANOVA concepts, F ratio, and interpretation. For full access and more problems, sign up free.