Lesson 12 — Chi-square Tests
The chi-square test ($$\chi^2$$) is used with categorical (nominal) data.
It compares observed frequencies with expected frequencies.
Chi-square Goodness-of-Fit
When to Use:
- One categorical variable
- Test if observed frequencies match expected frequencies
Formula:
$$\chi^2 = \sum \frac{(O - E)^2}{E}$$
In words:
$$\chi^2 = \text{sum of squared differences between observed and expected, divided by expected}$$
Example:
Survey of favorite subjects (Math, Science, English).
Expected = equal (⅓ each), Observed = [25, 30, 45].
Compute each (O–E)²/E, sum = χ².
Chi-square Test of Independence
When to Use:
- Two categorical variables
- Test whether they are associated (independent or not)
Formula:
$$\chi^2 = \sum \frac{(O - E)^2}{E}$$
Where expected frequencies:
$$E = \frac{(\text{row total})(\text{column total})}{\text{grand total}}$$
Example:
Gender (Male/Female) × Sport (Soccer/Basketball/Tennis).
If observed counts differ from expected, χ² tests independence.
Chi-square Correlation Measures
Chi-square can also give a measure of association strength between categorical variables.
- Phi coefficient (φ): for 2 × 2 tables
$$\phi = \sqrt{\frac{\chi^2}{N}}$$
- Cramer’s V: for larger tables
$$V = \sqrt{\frac{\chi^2}{N(k-1)}}$$
Where $$k = \min(\text{rows}, \text{columns})$$.
- Contingency coefficient (C):
$$C = \sqrt{\frac{\chi^2}{\chi^2 + N}}$$
Example (Phi, Cramer’s V, Contingency C)
Suppose χ² = 10.0, N = 100.
- For 2 × 2: $$\phi = \sqrt{10/100} = \sqrt{0.1} = 0.32$$
- For 3 × 2 table: $$V = \sqrt{10/(100(2-1))} = \sqrt{0.1} = 0.32$$
- Contingency coefficient: $$C = \sqrt{10/(10+100)} = \sqrt{0.09} = 0.30$$
Definition
- Goodness-of-fit: one categorical variable vs. expected distribution
- Independence: relationship between two categorical variables
- Correlation measures: strength of association in categorical tables (φ, V, C)
Visuals
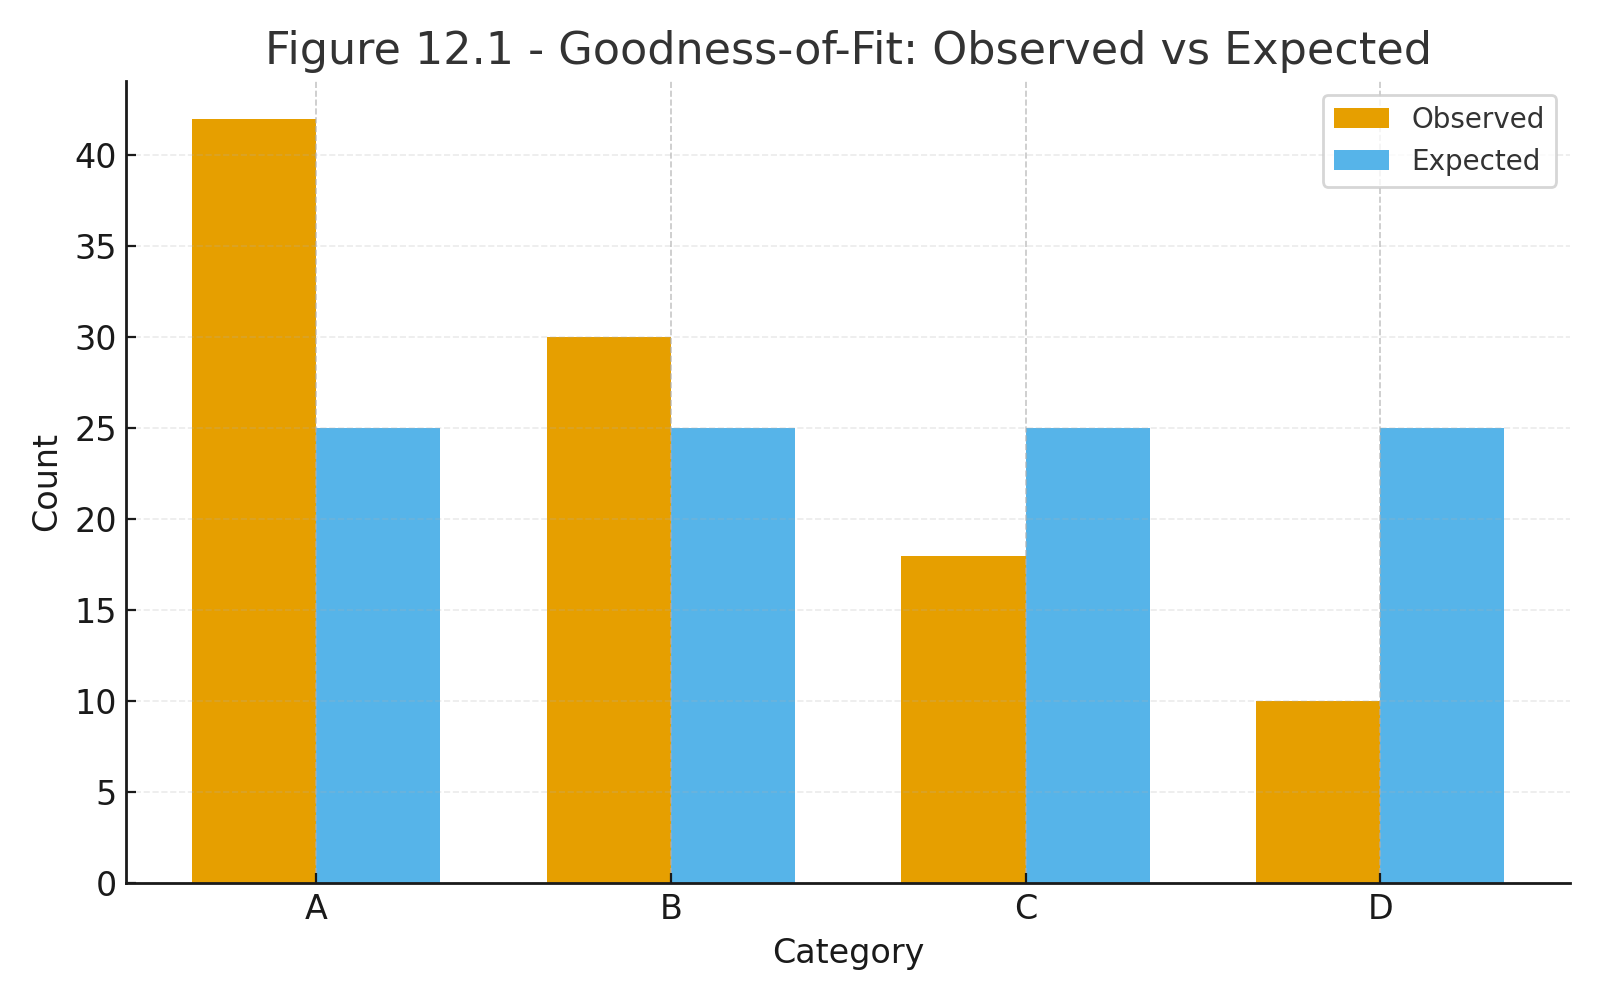
Figure 12.1 — Goodness-of-fit example: observed vs. expected bar chart.
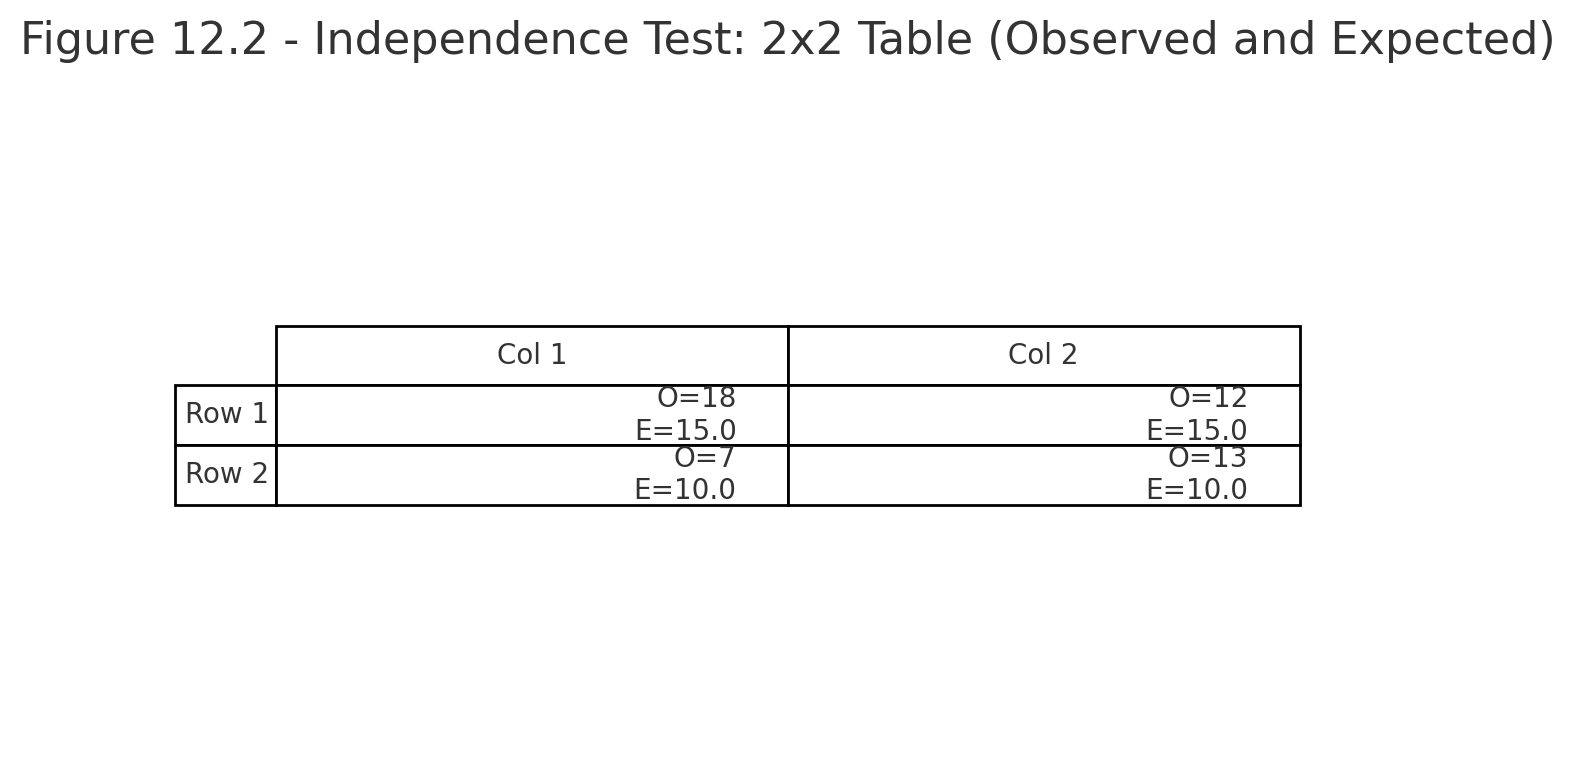
Figure 12.2 — Independence test: 2 × 2 contingency table with expected values.
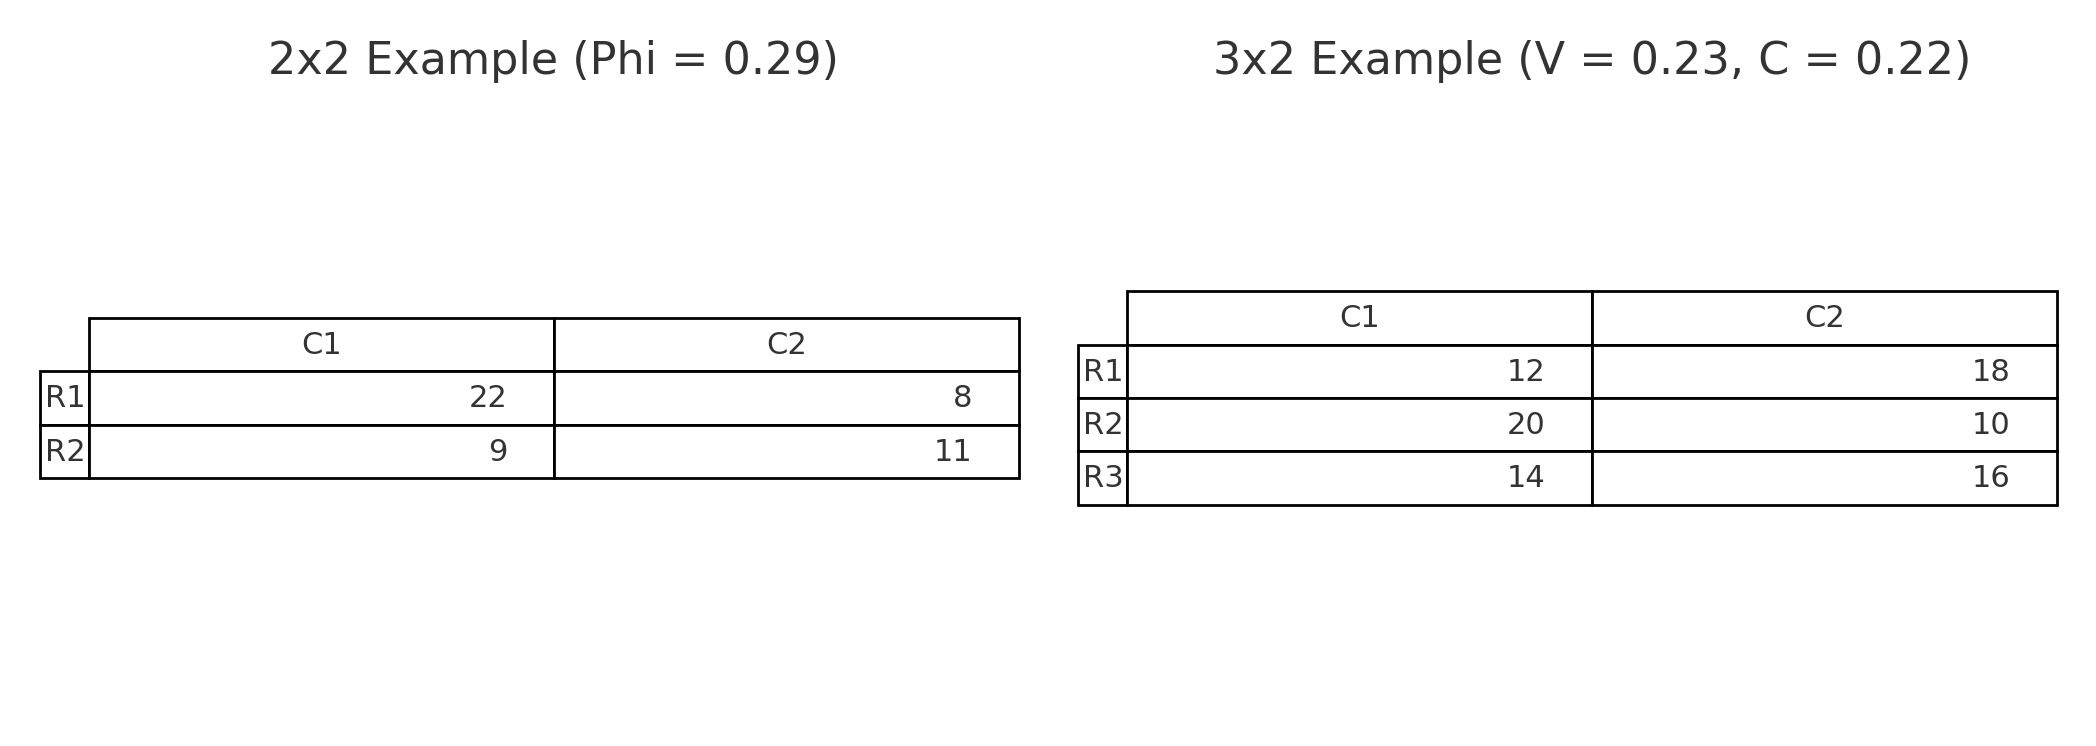
Figure 12.3 — Phi, Cramer’s V, and C illustrated with 2 × 2 and 3 × 2 tables.
Why This Matters
Chi-square lets us analyze data that are counts rather than scores.
It extends statistical testing beyond numbers into categories — essential for psychology, sociology, education, and medicine.
Practice self-test quiz
In the space below, please find practice problems and self-test quizzes. For full access, please signup free.