

Lecture 3 — Variance & Standard Deviation
The mean tells us the “typical” score. But how tightly do scores cluster around the mean? Do they spread widely, or are they close together?
To answer, we measure variability. Two key measures are the variance and the standard deviation.
Variance
Variance is the average squared distance of scores from the mean.
Symbolic formula:
$$s^2 = \frac{\sum (X - \bar{X})^2}{n - 1}$$
Formula in words:
$$\text{Variance} = \frac{\text{sum of squared deviations from the mean}}{\text{number of scores} - 1}$$
Where:
- $$s^2$$ = variance
- $$X$$ = each score
- $$\bar{X}$$ = mean
- $$n$$ = number of scores
Standard Deviation
The standard deviation is the square root of the variance. It puts variability back into the same units as the data.
Symbolic formula:
$$s = \sqrt{\frac{\sum (X - \bar{X})^2}{n - 1}}$$
Formula in words:
$$\text{Standard deviation} = \sqrt{\frac{\text{sum of squared deviations from the mean}}{\text{number of scores} - 1}}$$
Example
Data: 6, 8, 10
- Mean = 8
- Deviations: –2, 0, 2
- Squared deviations: 4, 0, 4
- Sum = 8
Variance:
$$s^2 = \frac{8}{3-1} = 4$$
Standard deviation:
$$s = \sqrt{4} = 2$$
So, on average, scores are 2 units away from the mean.
Definition
- Variance: average squared distance from the mean.
- Standard Deviation: square root of variance; typical distance from the mean.
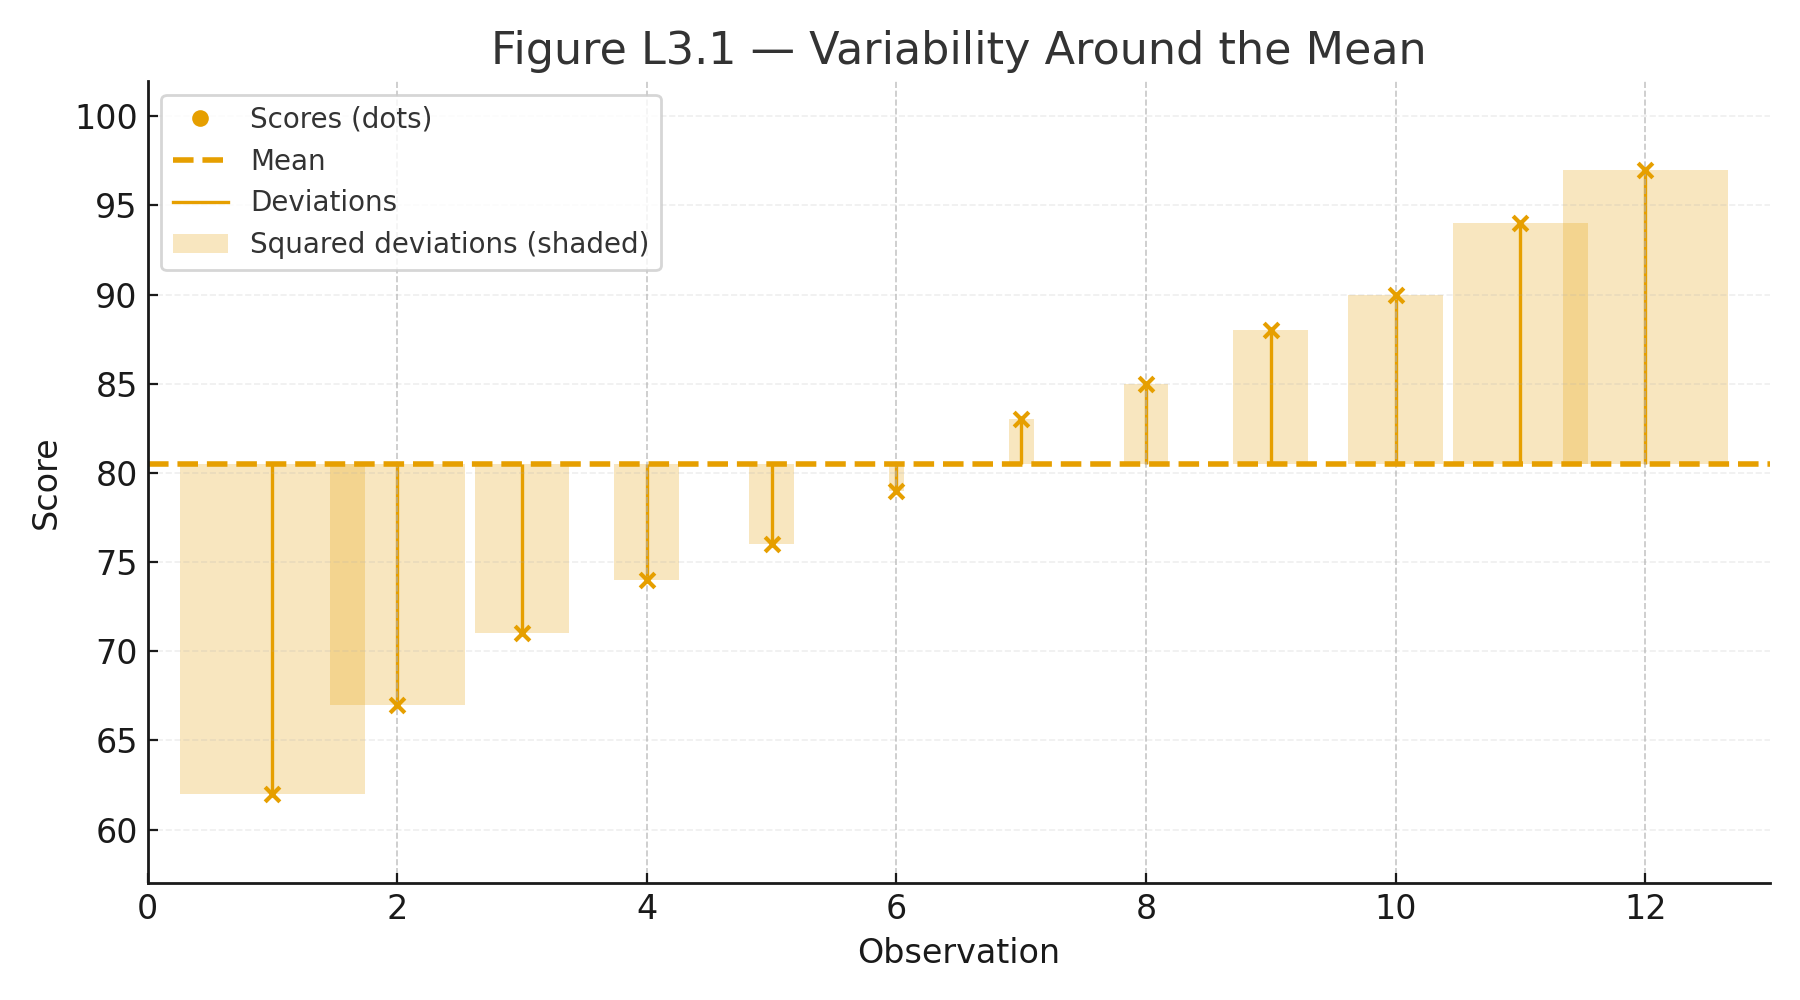
Visuals
Figure L3.1 — Variability Around the Mean. Dot plot of scores with the mean marked, vertical lines for deviations, and shaded boxes for squared deviations.
Why This Matters
Two sets of scores can have the same mean but very different spreads.
Variance and standard deviation give us the language to describe spread, and they are the building blocks for t-tests, ANOVA, and all inferential statistics.
Practice self-test quiz
In the space below, please find practice problems and self-test quizzes. For full access, please signup free.