Statistics 2nd ed

descriptive statistics

Lesson 3 — Variance & Standard Deviation

variability around the mean

After finding the mean, the next question is: How much do the scores vary around that mean?
Variation tells us whether data are tightly clustered or widely spread. Two common measures are the variance and the standard deviation.


Variance and standard deviation - formal level

Variance and standard deviation - intuitive level

Variance

Variance is the average squared distance of each score from the mean.

Symbolic formula:
$$s^2 = \frac{\sum (X - \bar{X})^2}{n - 1}$$

Formula in words:
$$\text{Variance} = \frac{\text{sum of squared deviations from the mean}}{\text{number of scores} - 1}$$

Where:

  • $$s^2$$ = variance
  • $$X$$ = each score
  • $$\bar{X}$$ = mean
  • $$n$$ = number of scores

Example: Data: 6, 8, 10

  • Mean = 8
  • Deviations: (6–8) = –2, (8–8) = 0, (10–8) = 2
  • Squared deviations: 4, 0, 4
  • Sum = 8

Variance = $$\tfrac{8}{3-1} = 4$$


Standard Deviation

The standard deviation is the square root of the variance.

Symbolic formula:
$$s = \sqrt{\frac{\sum (X - \bar{X})^2}{n - 1}}$$

Formula in words:
$$\text{Standard deviation} = \sqrt{\frac{\text{sum of squared deviations from the mean}}{\text{number of scores} - 1}}$$

Example continued:
Variance = 4 → Standard deviation = $$\sqrt{4} = 2$$

So, on average, scores are about 2 units away from the mean.


Definition

  • Variance: average squared distance from the mean.
  • Standard Deviation: square root of variance; typical distance from the mean.
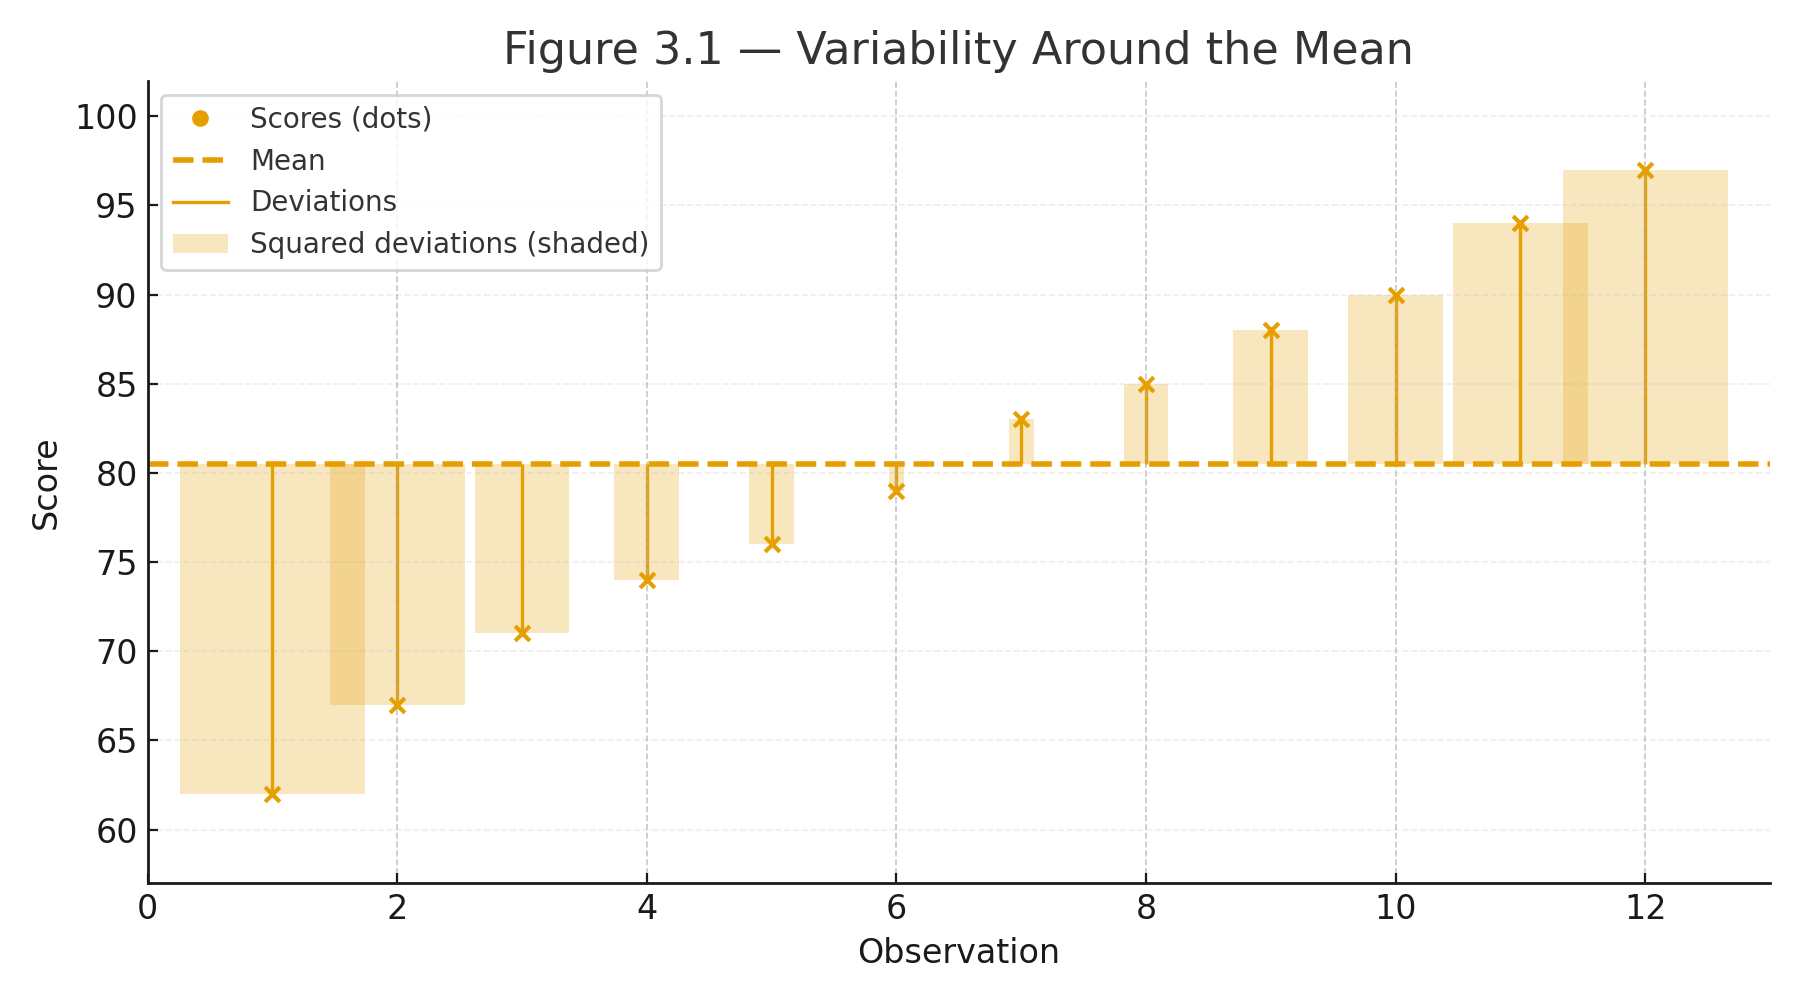
Visuals

Figure 3.1 — Variability Around the Mean. A dot plot of scores with the mean marked, vertical lines showing deviations, and shaded boxes for squared deviations.


Why This Matters

Two sets of data can have the same mean but very different spreads.
Variance and standard deviation give us the language to describe that spread.
They are the foundation for most inferential tests in statistics.

Practice self-test quiz

In the space below, please find practice problems and self-test quizzes. For full access, please signup free.

Lesson 2 — The Averages

mean mode median

When we look at a set of numbers, the first question is: What is the typical value?
Statistics gives us three common answers — the mean, the median, and the mode.

Each describes “typical” in a different way.


The Mean

The mean is the arithmetic average — the balance point of the data.

Symbolic formula:
$$\bar{X} = \frac{\sum X}{n}$$

Formula in words:
$$\text{Mean} = \frac{\text{sum of scores}}{\text{number of scores}}$$

Where:

  • $$\bar{X}$$ = mean (X bar)
  • $$\sum X$$ = sum of all scores
  • $$n$$ = number of scores

Example: Scores: 10, 8, 7

$$\bar{X} = \frac{10 + 8 + 7}{3} = \frac{25}{3} = 8.33$$

So the mean is about 8.3.


The Median

The median is the middle value when the numbers are placed in order.

Steps:

  1. Arrange the scores from smallest to largest.
  2. If there are an odd number of scores, the median is the middle one.
  3. If there are an even number of scores, the median is the average of the two middle ones.

Examples:

  • Data: 5, 7, 9 → Median = 7
  • Data: 4, 6, 10, 12 → Median = (6 + 10)/2 = 8

The Mode

The mode is the most frequent score.

Example: Data: 2, 2, 4, 5, 5, 5, 7 → Mode = 5


Definition

  • Mean: arithmetic average; balance point.
  • Median: middle score; divides data in half.
  • Mode: most frequent score.

Visuals

Figure 2.1 — Mean, Median, Mode compared on a skewed dataset. Histogram with three markers: red line = mean, green line = median, purple line = mode.


Why These Matter

  • The mean is sensitive to extreme values.
  • The median resists extremes and can better represent a “typical” score.
  • The mode is useful for categorical or count data.

Together, the three averages give us a rounded view of what is typical in a dataset.

Practice self-test quiz

In the space below, please find practice problems and self-test quizzes. For full access, please signup free.

Lesson 1: What Is Statistics? Why Does It Matter?

Flowchart illustrating the first decision in statistics: descriptive versus inferential methods, with inferential statistics divided into parametric and nonparametric analyses.es.


Statistics is the science of learning from data. It provides the tools to decide whether what we observe is real or accidental, and whether a difference is large enough to matter.

When a scientist runs an experiment, or when a pollster surveys a group of voters, the results always vary. Statistics gives us a way to interpret that variation and to draw conclusions.

The Two Branches of Statistics

  • Descriptive Statistics describe and summarize what we see.
    Example: “The average score on the math test was 78.”
  • Inferential Statistics use a sample to make conclusions about a larger group.
    Example: “Based on this sample, we estimate the average score for all students in the district.”

Definition:

  • Descriptive statistics = picture of the data.
  • Inferential statistics = prediction about the population.

Parametric vs. Non-parametric Statistics

There are two main families of tests:

  • Parametric tests (such as the t-test or ANOVA) assume certain conditions in the data, like normal distribution and interval/ratio measurement.
  • Non-parametric tests (such as Chi-square or Mann–Whitney) require fewer assumptions and are used when data are ranks (ordinal) or categories (nominal).

Simple rule of thumb:

  • If data are interval or ratio (e.g., test scores, heights), use parametric tests.
  • If data are ordinal or nominal (e.g., ranks, categories), use non-parametric tests.

First Formula in Statistics: The Mean

The mean is our first step toward summarizing data.

Symbolic formula:
$$\bar{X} = \frac{\sum X}{n}$$

Formula in words:
$$\text{Mean} = \frac{\text{sum of scores}}{\text{number of scores}}$$

Where:

  • $$\bar{X}$$ = mean (X bar)
  • $$\sum X$$ = sum of all scores
  • $$n$$ = number of scores

Example: Data: 6, 8, 10

$$\bar{X} = \frac{6 + 8 + 10}{3} = \frac{24}{3} = 8$$

So the mean is 8.

Visual

Figure 1.1 — The First Decision in Statistics. A flowchart: Descriptive vs. Inferential → Parametric vs. Non-parametric, with examples inside each box.

Why This Matters

Before you can choose the right statistical test, you must know:

  1. What kind of data you have (descriptive vs. inferential).
  2. How those data are measured (nominal, ordinal, interval, ratio).
  3. Which family of tests applies (parametric vs. non-parametric).

This chapter sets the stage. The rest of the book builds from here, using only a small set of simple formulas to unlock the logic of statistics.

Practice self-test quiz

In the space below, please find practice problems and self-test quizzes. For full access, please signup free.