

Lesson 2 — The Averages
When we look at a set of numbers, the first question is: What is the typical value?
Statistics gives us three common answers — the mean, the median, and the mode.
Each describes “typical” in a different way.
The Mean
The mean is the arithmetic average — the balance point of the data.
Symbolic formula:
$$\bar{X} = \frac{\sum X}{n}$$
Formula in words:
$$\text{Mean} = \frac{\text{sum of scores}}{\text{number of scores}}$$
Where:
- $$\bar{X}$$ = mean (X bar)
- $$\sum X$$ = sum of all scores
- $$n$$ = number of scores
Example: Scores: 10, 8, 7
$$\bar{X} = \frac{10 + 8 + 7}{3} = \frac{25}{3} = 8.33$$
So the mean is about 8.3.
The Median
The median is the middle value when the numbers are placed in order.
Steps:
- Arrange the scores from smallest to largest.
- If there are an odd number of scores, the median is the middle one.
- If there are an even number of scores, the median is the average of the two middle ones.
Examples:
- Data: 5, 7, 9 → Median = 7
- Data: 4, 6, 10, 12 → Median = (6 + 10)/2 = 8
The Mode
The mode is the most frequent score.
Example: Data: 2, 2, 4, 5, 5, 5, 7 → Mode = 5
Definition
- Mean: arithmetic average; balance point.
- Median: middle score; divides data in half.
- Mode: most frequent score.
Visuals
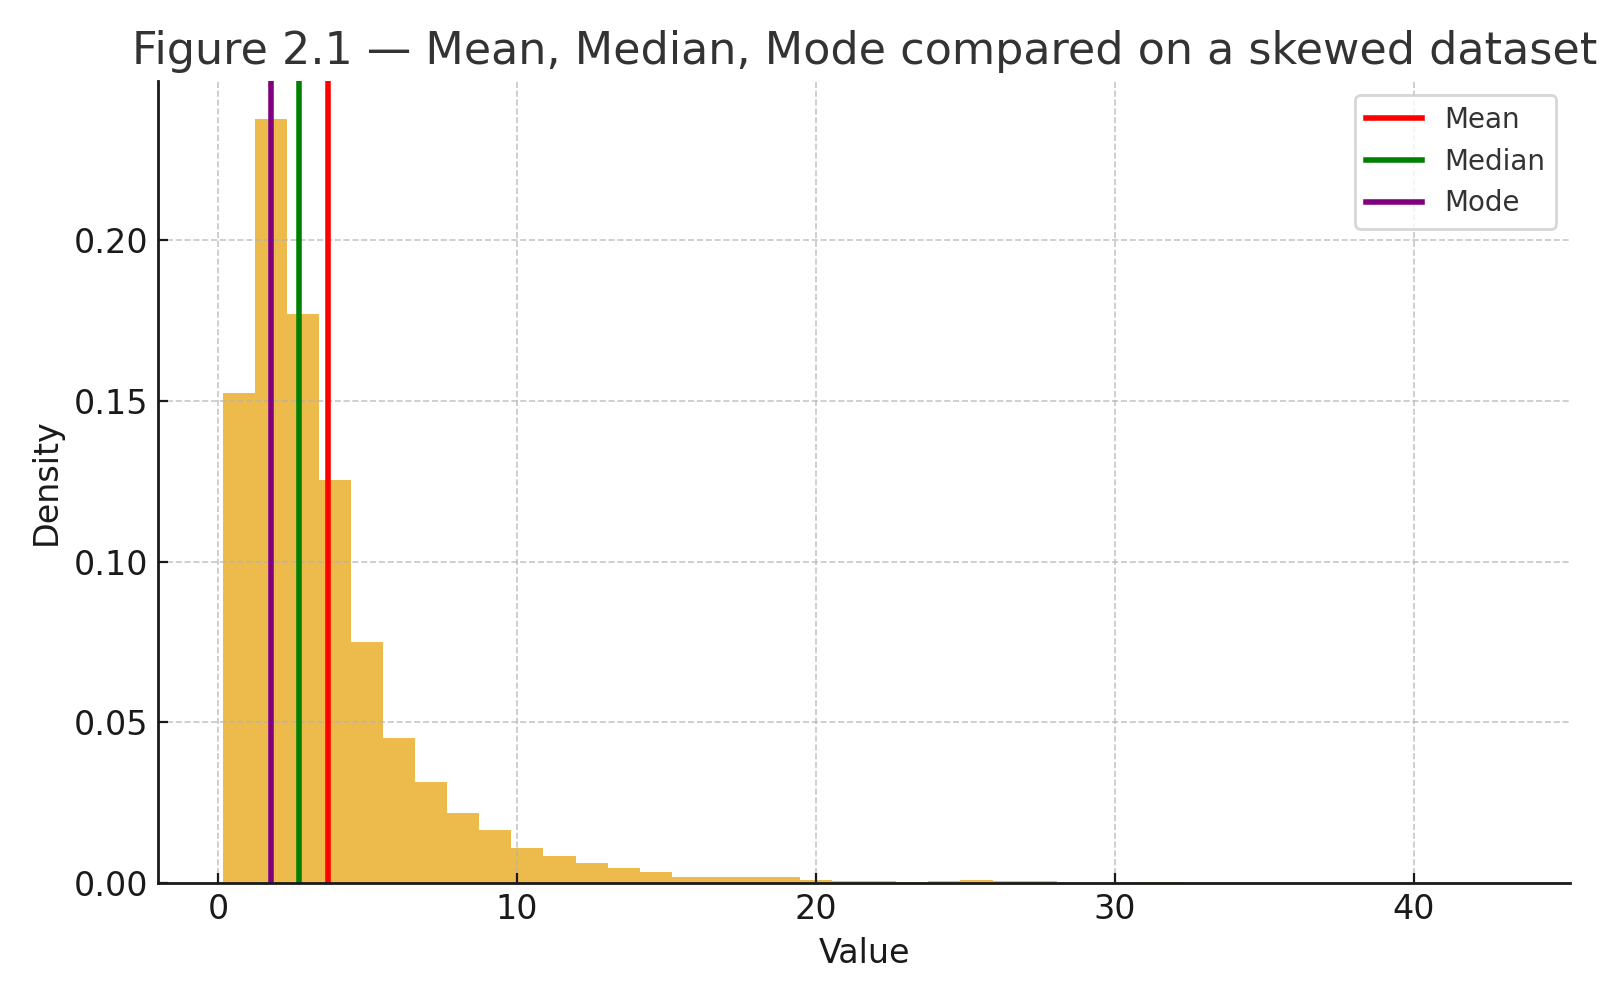
Figure 2.1 — Mean, Median, Mode compared on a skewed dataset. Histogram with three markers: red line = mean, green line = median, purple line = mode.
Why These Matter
- The mean is sensitive to extreme values.
- The median resists extremes and can better represent a “typical” score.
- The mode is useful for categorical or count data.
Together, the three averages give us a rounded view of what is typical in a dataset.
Practice self-test quiz
In the space below, please find practice problems and self-test quizzes. For full access, please signup free.