Lesson 4 — The Standard Normal Curve

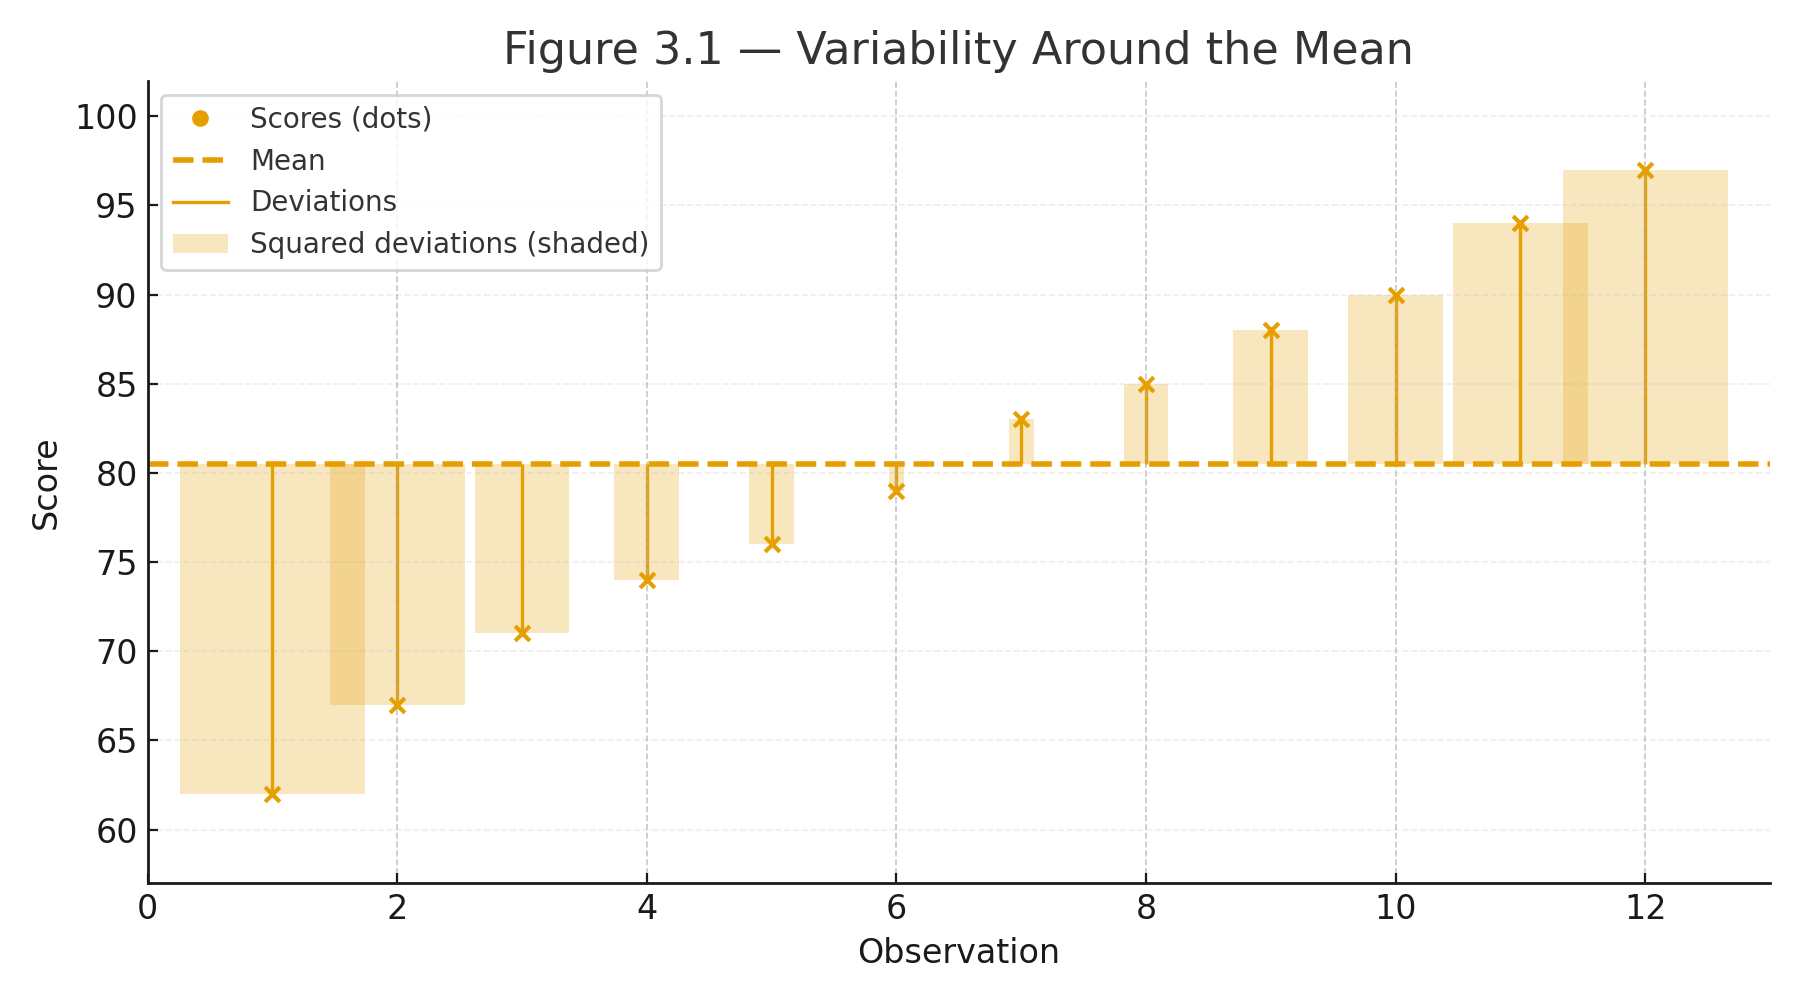
The normal curve (bell curve) is one of the most important shapes in statistics. It appears when many small, independent factors combine: height, test scores, measurement errors.
For a simple, intuitive presentation go to Part 2
Properties of the Normal Curve
- Symmetrical around the mean
- Unimodal (one peak)
- Mean = Median = Mode
- The total area under the curve = 1 (or 100%)
Formula for the Normal Distribution
Unless you are in Mathematical Statistics, you will never be asked to reproduce it, or otherwise work with it.
Symbolic formula:
$$f(x) = \frac{1}{\sigma \sqrt{2\pi}} e^{-\frac{(x - \mu)^2}{2\sigma^2}}$$
Formula in words:
$$\text{Probability density} = \frac{1}{\text{standard deviation} \times \sqrt{2\pi}} \times e^{-\frac{(\text{score} - \text{mean})^2}{2 \times (\text{standard deviation})^2}}$$
Where:
- $$\mu$$ = mean
- $$\sigma$$ = standard deviation
- $$x$$ = a value on the curve
Standardization (z-scores)
Symbolic formula:
$$z = \frac{x - \mu}{\sigma}$$
Formula in words:
$$z = \frac{\text{score} - \text{mean}}{\text{standard deviation}}$$
A z-score tells us how many standard deviations a score is above or below the mean.
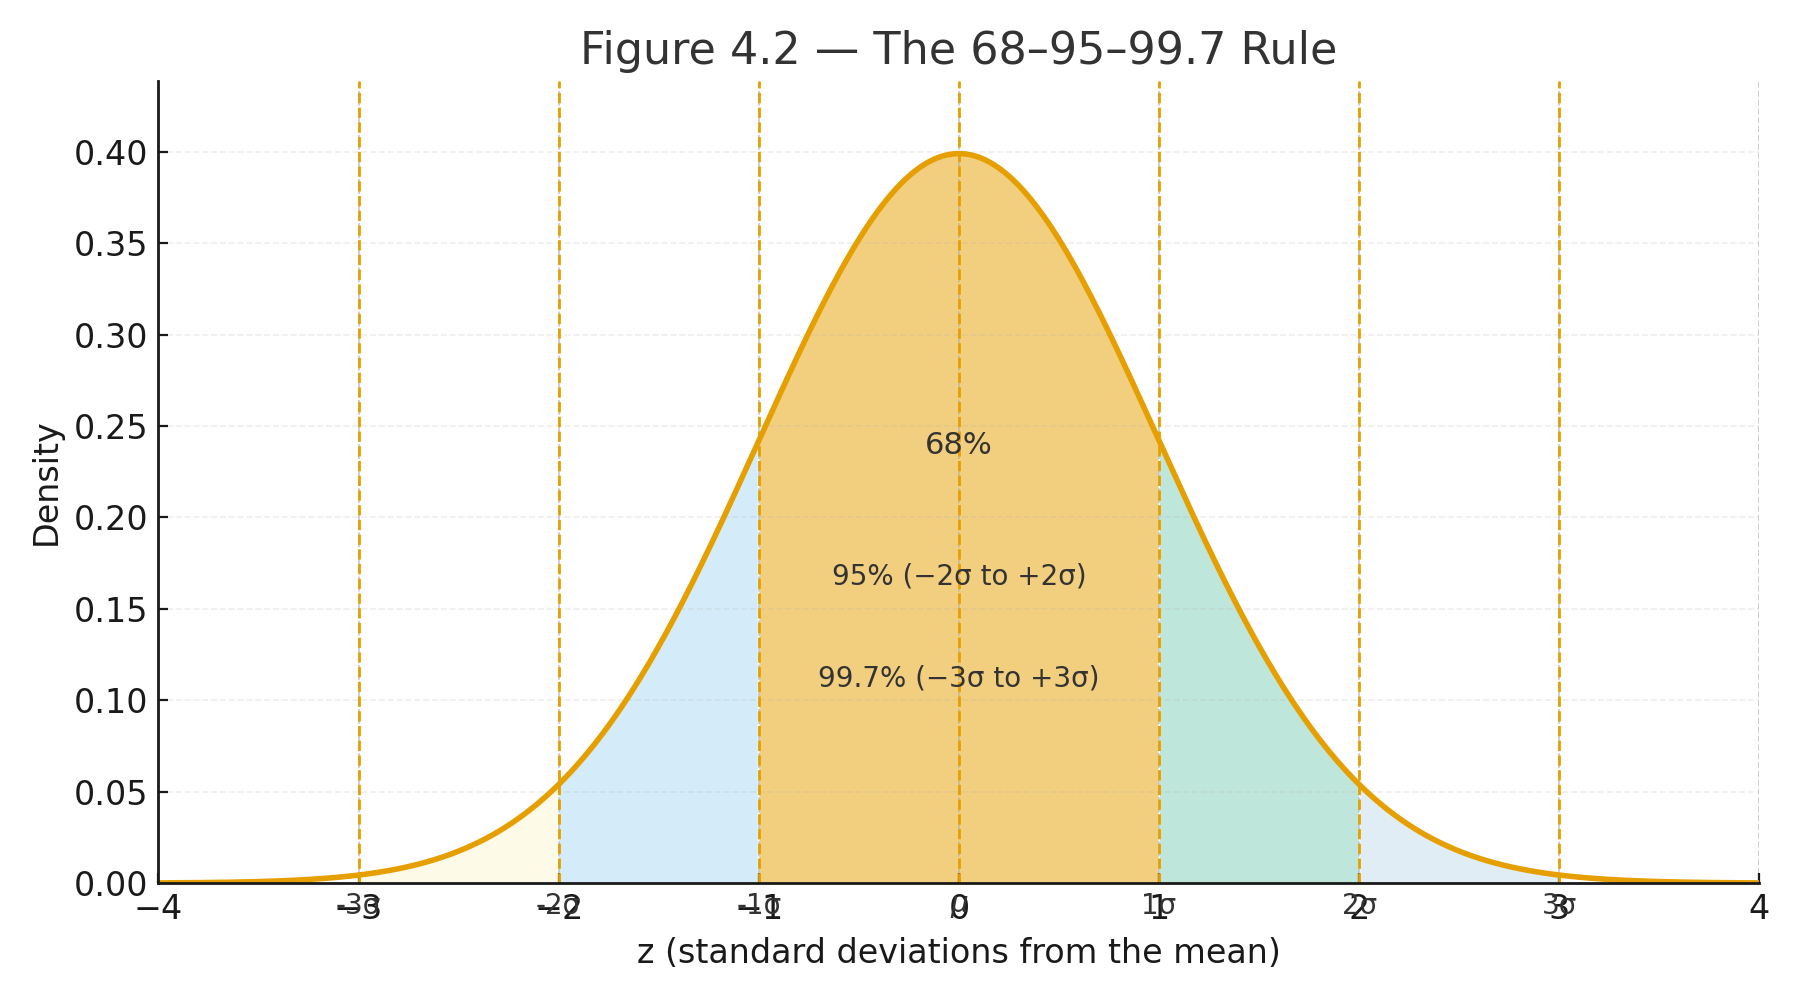
Key Percentages
Under the normal curve:
- About 68% of scores are within 1 standard deviation of the mean
- About 95% are within 2 standard deviations
- About 99.7% are within 3 standard deviations
This is called the 68–95–99.7 rule.
Example
Suppose test scores are normally distributed with
- $$\mu = 100$$
- $$\sigma = 15$$
What is the z-score for a student who scored 115?
$$z = \frac{115 - 100}{15} = \frac{15}{15} = 1$$
This means the student is 1 standard deviation above the mean.
Visuals
Figure 4.1 — The Normal Curve. A bell-shaped curve centered at the mean (μ).
Figure 4.2 — The 68–95–99.7 Rule. A normal curve with shaded regions for ±1σ, ±2σ, ±3σ.
Figure 4.3 — z-Score Example. Normal curve with shaded area to the left of z = 1.0, labeled 0.8413.
Why This Matters
The normal curve is the foundation of inferential statistics.
- It allows us to compute probabilities.
- It underlies the t-test, ANOVA, and confidence intervals.
- By using z-scores, we can compare scores across different tests and distributions.
Practice self-test quiz
In the space below, please find practice problems and self-test quizzes. For full access, please signup free.