Lesson 11 — Non-parametric Tests
Most tests so far (t-tests, ANOVA, regression) are parametric.
They assume:
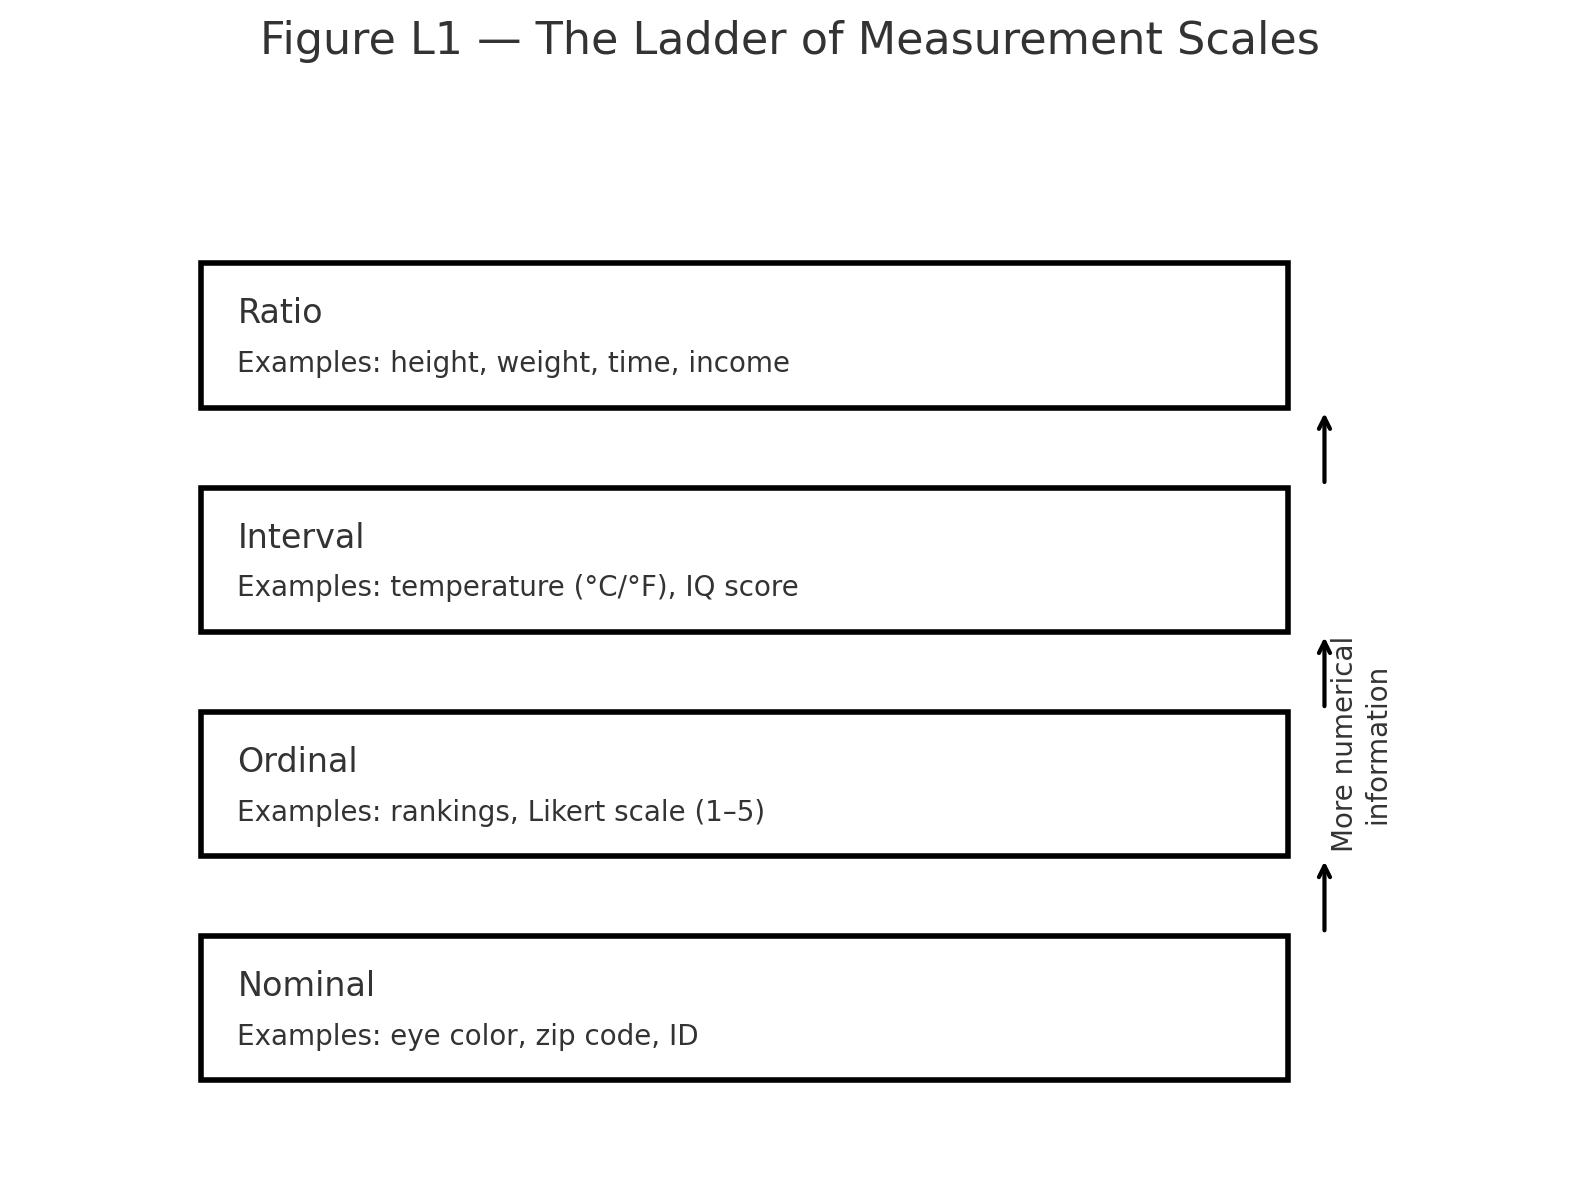
- Interval/ratio data
- Approximately normal distribution
- Homogeneity of variance
But what if these assumptions are not met?
Or if data are ranks or categories?
Then we use non-parametric tests.
They make fewer assumptions and are based on ranks, not raw scores.
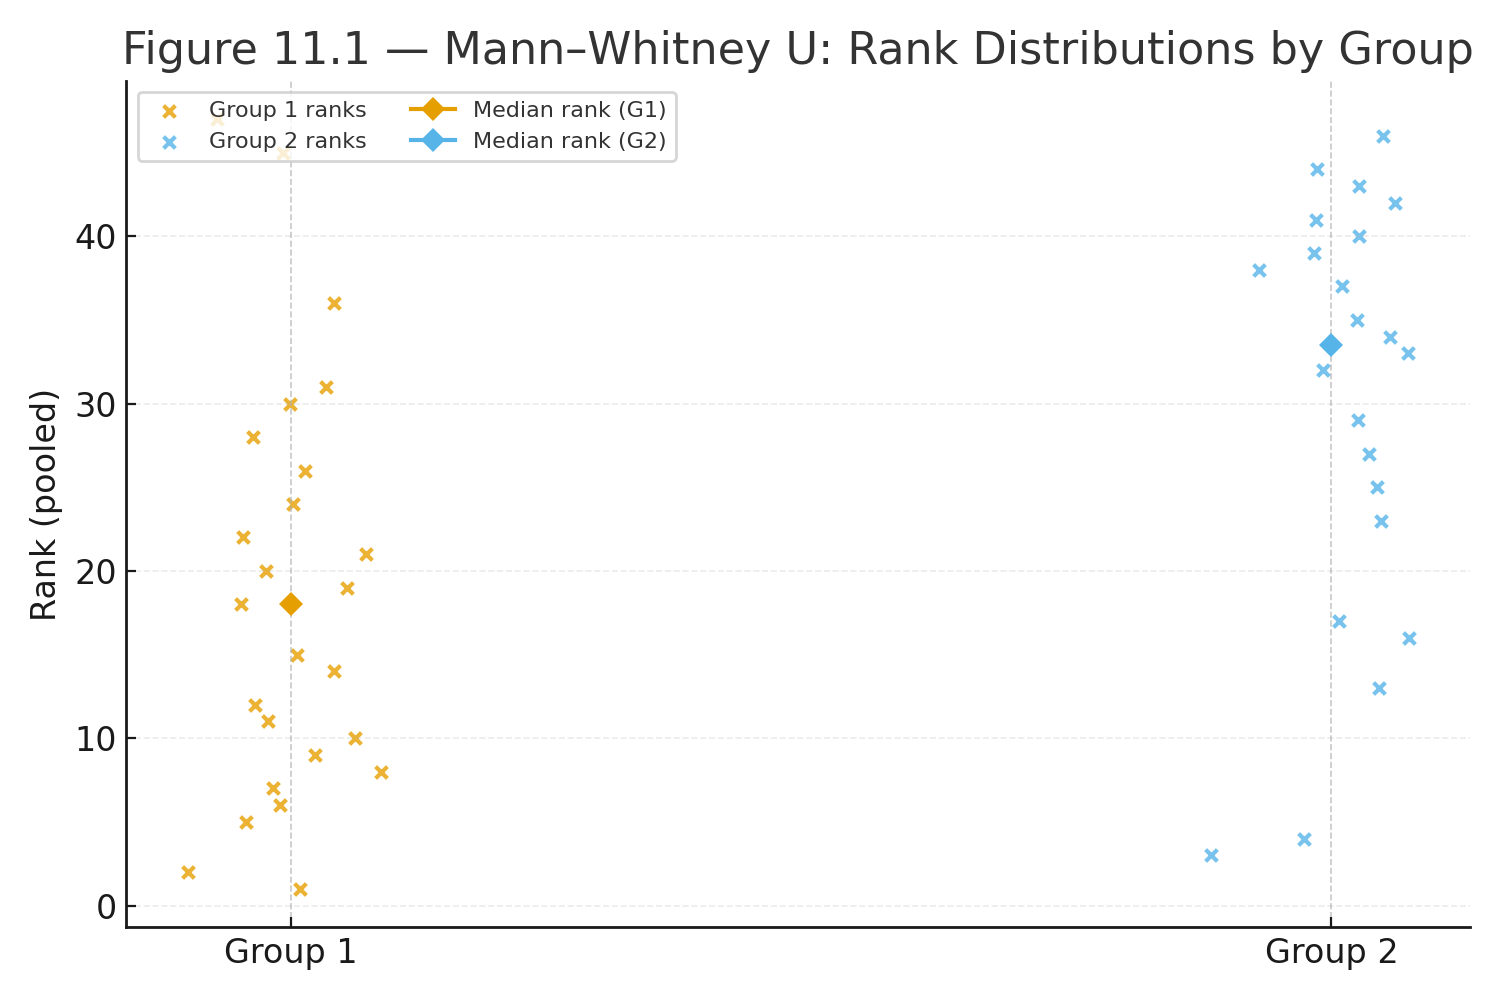
Mann–Whitney U Test
When to Use:
- Compare two independent groups, ordinal or non-normal data.
- Non-parametric alternative to independent t-test.
Formula:
$$U = n_1 n_2 + \frac{n_1(n_1 + 1)}{2} - R_1$$
Where $$R_1$$ = sum of ranks for group 1.
Example:
Two groups (n = 5 each) ranked by performance. Compute rank sums, plug into U formula.
Wilcoxon Signed-Rank Test
When to Use:
- Compare the same group measured twice.
- Ordinal or non-normal data.
- Non-parametric alternative to paired t-test.
Procedure:
- Compute differences (After – Before).
- Rank absolute differences.
- Add signs.
- Test statistic = smaller signed sum.
Example:
5 students tested before/after training → positive ranks dominate → training helps.
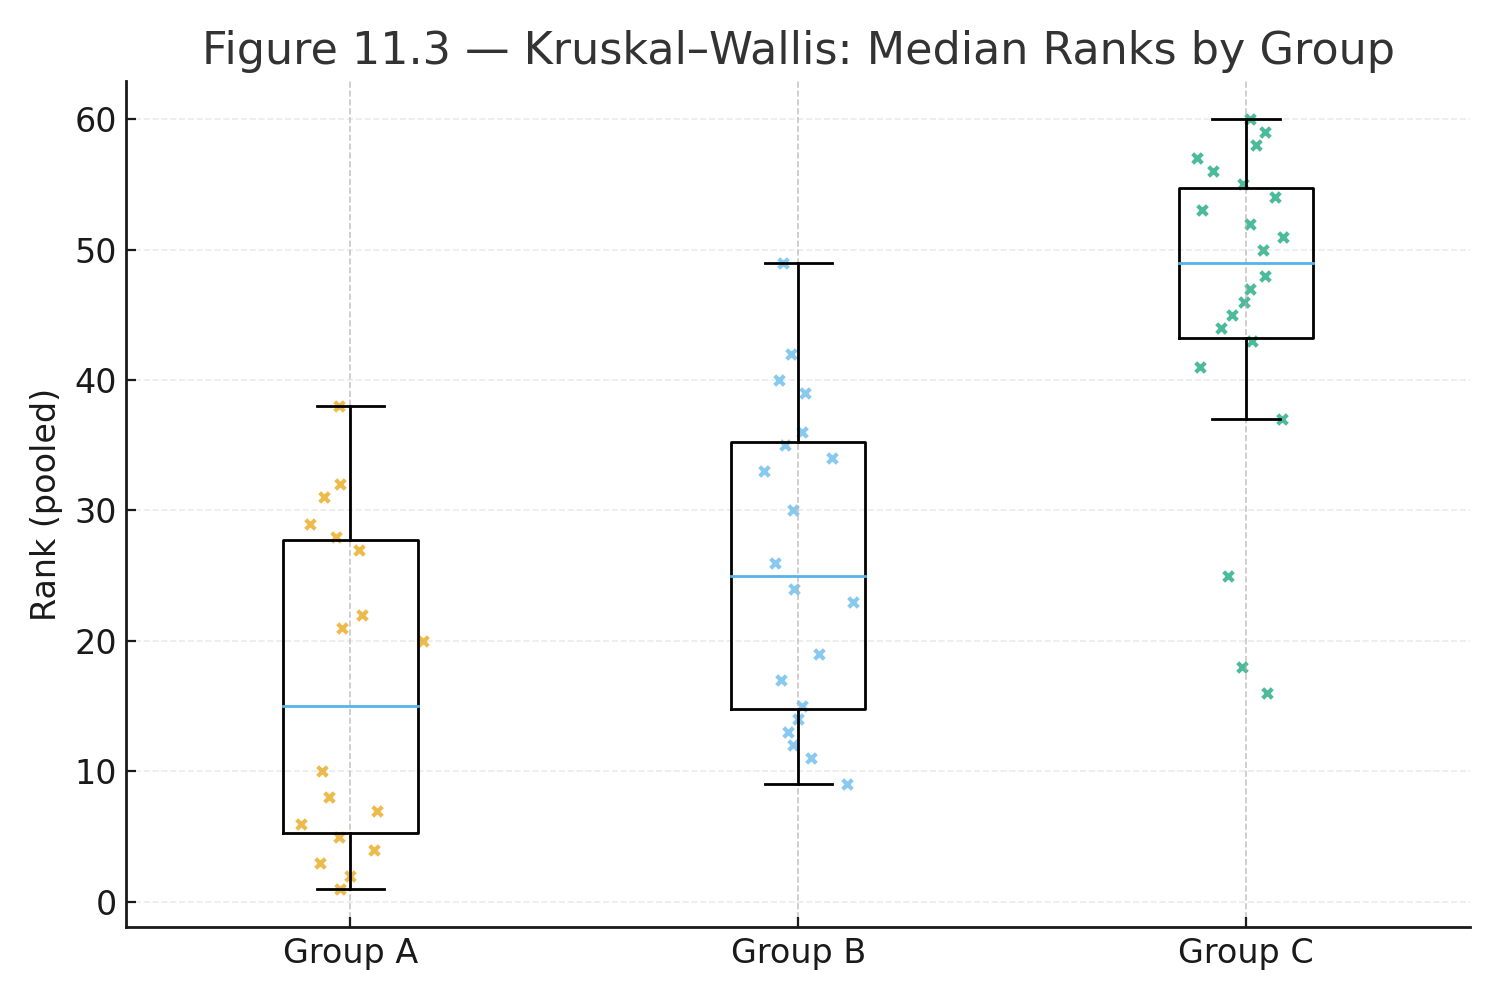
Kruskal–Wallis Test
When to Use:
- Compare 3+ independent groups.
- Ordinal or non-normal data.
- Non-parametric alternative to one-way ANOVA.
Formula:
$$H = \frac{12}{N(N+1)} \sum \frac{R_j^2}{n_j} - 3(N+1)$$
Where:
- $$R_j$$ = sum of ranks in group j
- $$n_j$$ = group size
- $$N$$ = total number of cases
Example:
Three therapy groups (n = 6 each). Rank improvement scores → compare H to χ² distribution.
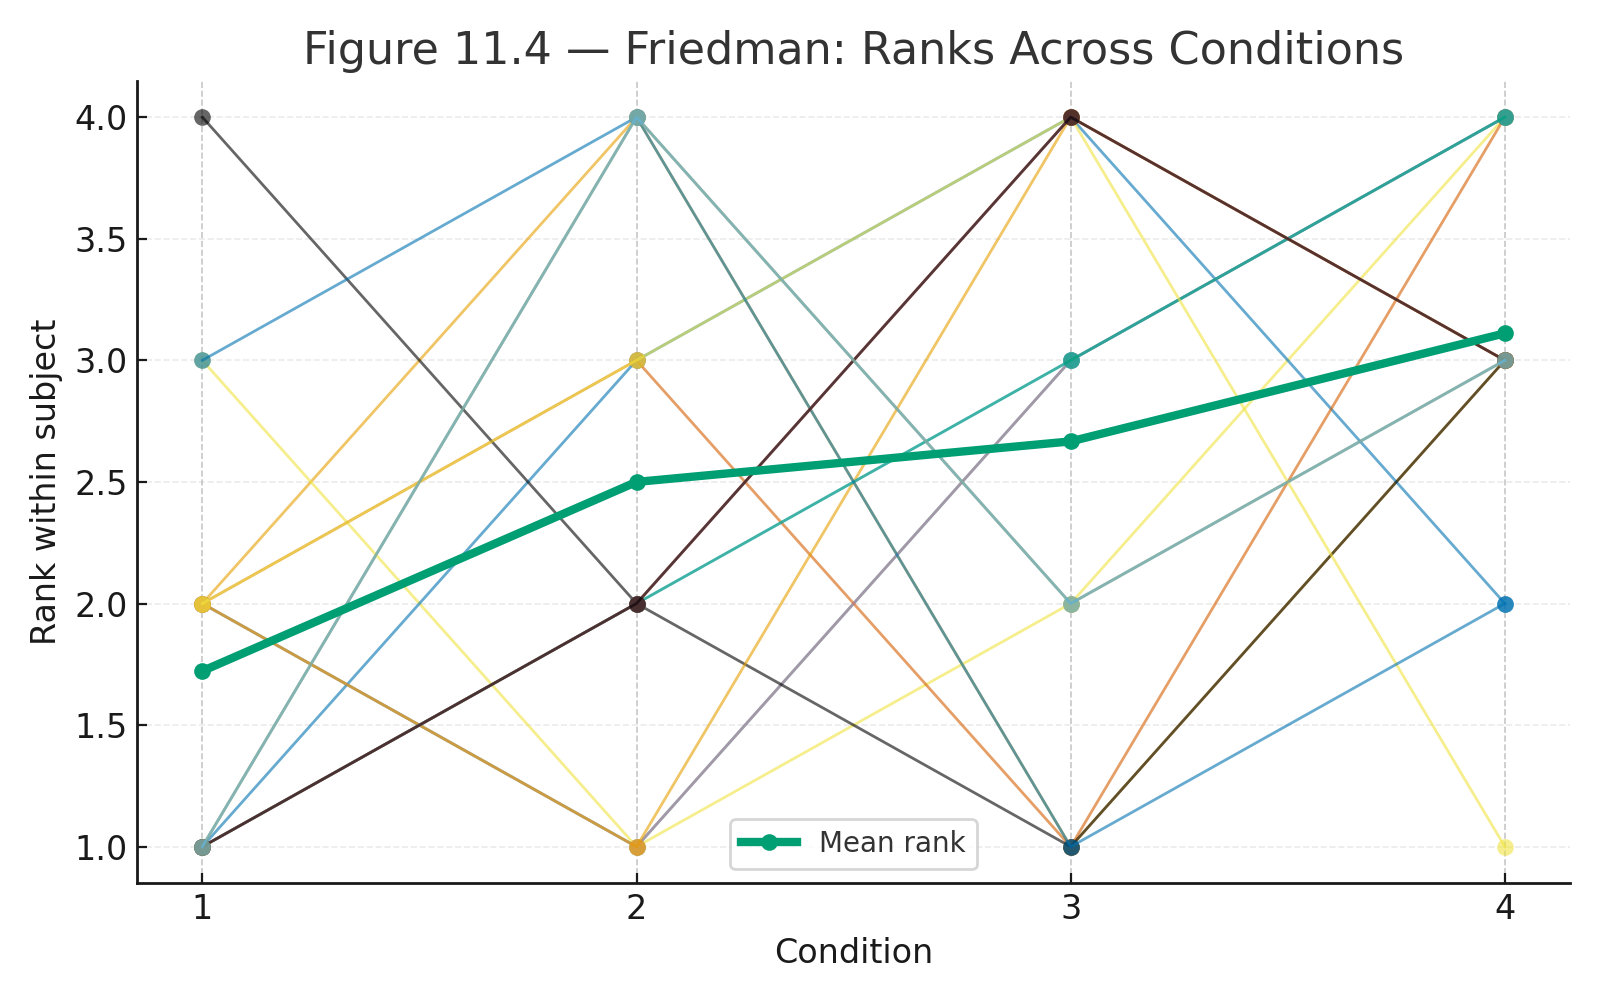
Friedman Test
When to Use:
- Compare 3+ related groups (repeated measures).
- Ordinal or non-normal data.
- Non-parametric alternative to repeated-measures ANOVA.
Formula:
$$Q = \frac{12}{nk(k+1)} \sum R_j^2 - 3n(k+1)$$
Where:
- $$R_j$$ = rank sum for each condition
- $$n$$ = number of subjects
- $$k$$ = number of conditions
Example:
10 participants ranked across 3 learning tasks. Compare Q to χ² distribution.
Definition
- Non-parametric tests: statistical tests based on ranks, not raw scores
- Used when parametric assumptions fail or data are ordinal
Visuals
Figure 11.1 — Mann–Whitney U test: two groups compared by rank distributions.
Figure 11.2 — Wilcoxon signed-rank: before/after ranks with arrows.
Figure 11.3 — Kruskal–Wallis layout: three groups compared by median ranks.
Figure 11.4 — Friedman layout: subjects compared across repeated conditions.
Why This Matters
Non-parametric tests give us flexibility.
They extend statistical reasoning to real-world data that are messy, skewed, or categorical.
They are essential tools for psychology, education, and biology.
Practice self-test quiz
In the space below, please find practice problems and self-test quizzes. For full access, please signup free.