

Correlation tells us the strength of the relationship between two variables.
Regression goes one step further: it gives us an equation to predict one variable from another.
The Regression Equation
The regression line predicts Y from X.
Symbolic formula:
$$\hat{Y} = a + bX$$
Formula in words:
$$\text{Predicted Y} = \text{intercept} + (\text{slope} \times X)$$
Where:
- $$\hat{Y}$$ = predicted value of Y
- $$a$$ = intercept (value of Y when X = 0)
- $$b$$ = slope (change in Y for each 1-unit change in X)
Slope and Intercept
The slope is calculated as:
$$b = \frac{\sum (X - \bar{X})(Y - \bar{Y})}{\sum (X - \bar{X})^2}$$
The intercept is:
$$a = \bar{Y} - b\bar{X}$$
Example
Study hours (X) and test scores (Y):
- X = [2, 4, 6]
- Y = [50, 60, 80]
- $$\bar{X} = 4, \quad \bar{Y} = 63.3$$
Step 1: Slope
- Numerator = Σ(X – X̄)(Y – Ȳ) = 60
- Denominator = Σ(X – X̄)² = 8
- $$b = \tfrac{60}{8} = 7.5$$
Step 2: Intercept
- $$a = 63.3 - (7.5)(4) = 33.3$$
Regression equation:
$$\hat{Y} = 33.3 + 7.5X$$
Interpretation: each extra study hour adds about 7.5 points to the predicted test score.
Coefficient of Determination
The square of the correlation, $$r^2$$, shows the proportion of variance explained by regression.
Here: $$r^2 = 0.98$$, so 98% of score variation is explained by study hours.
Definition
- Regression: predicts one variable from another using a line
- Slope (b): how much Y changes per unit change in X
- Intercept (a): expected value of Y when X = 0
- r²: proportion of variance explained by regression
Visuals
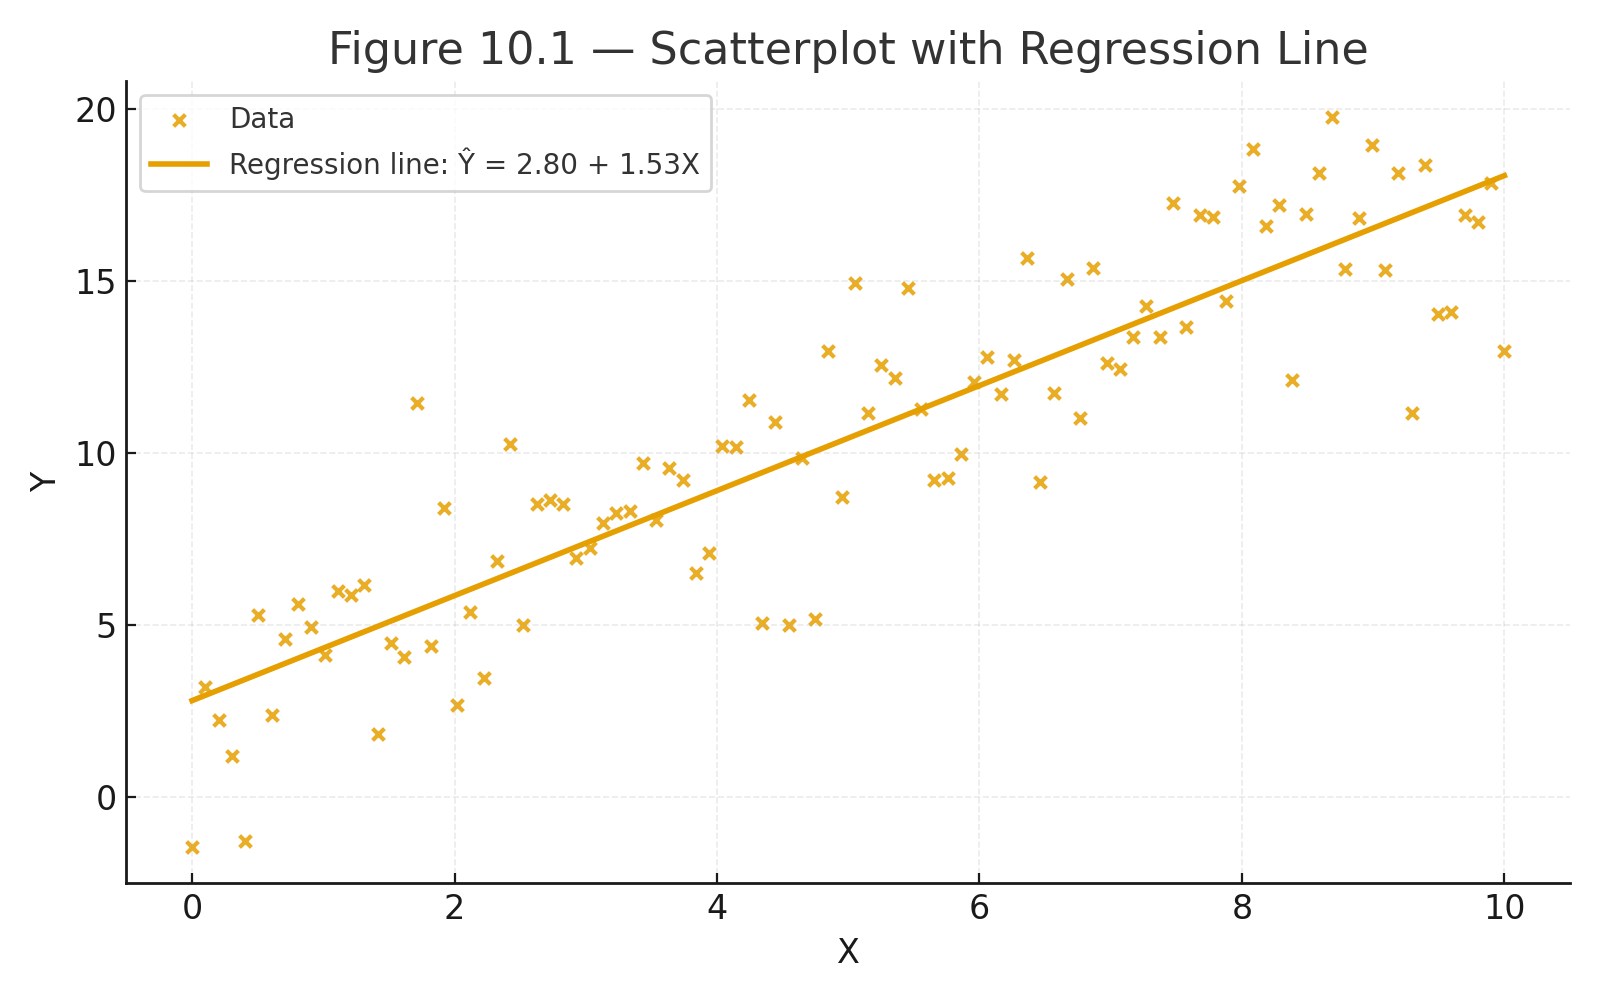
Figure 10.1 — Scatterplot with regression line (Y predicted from X).
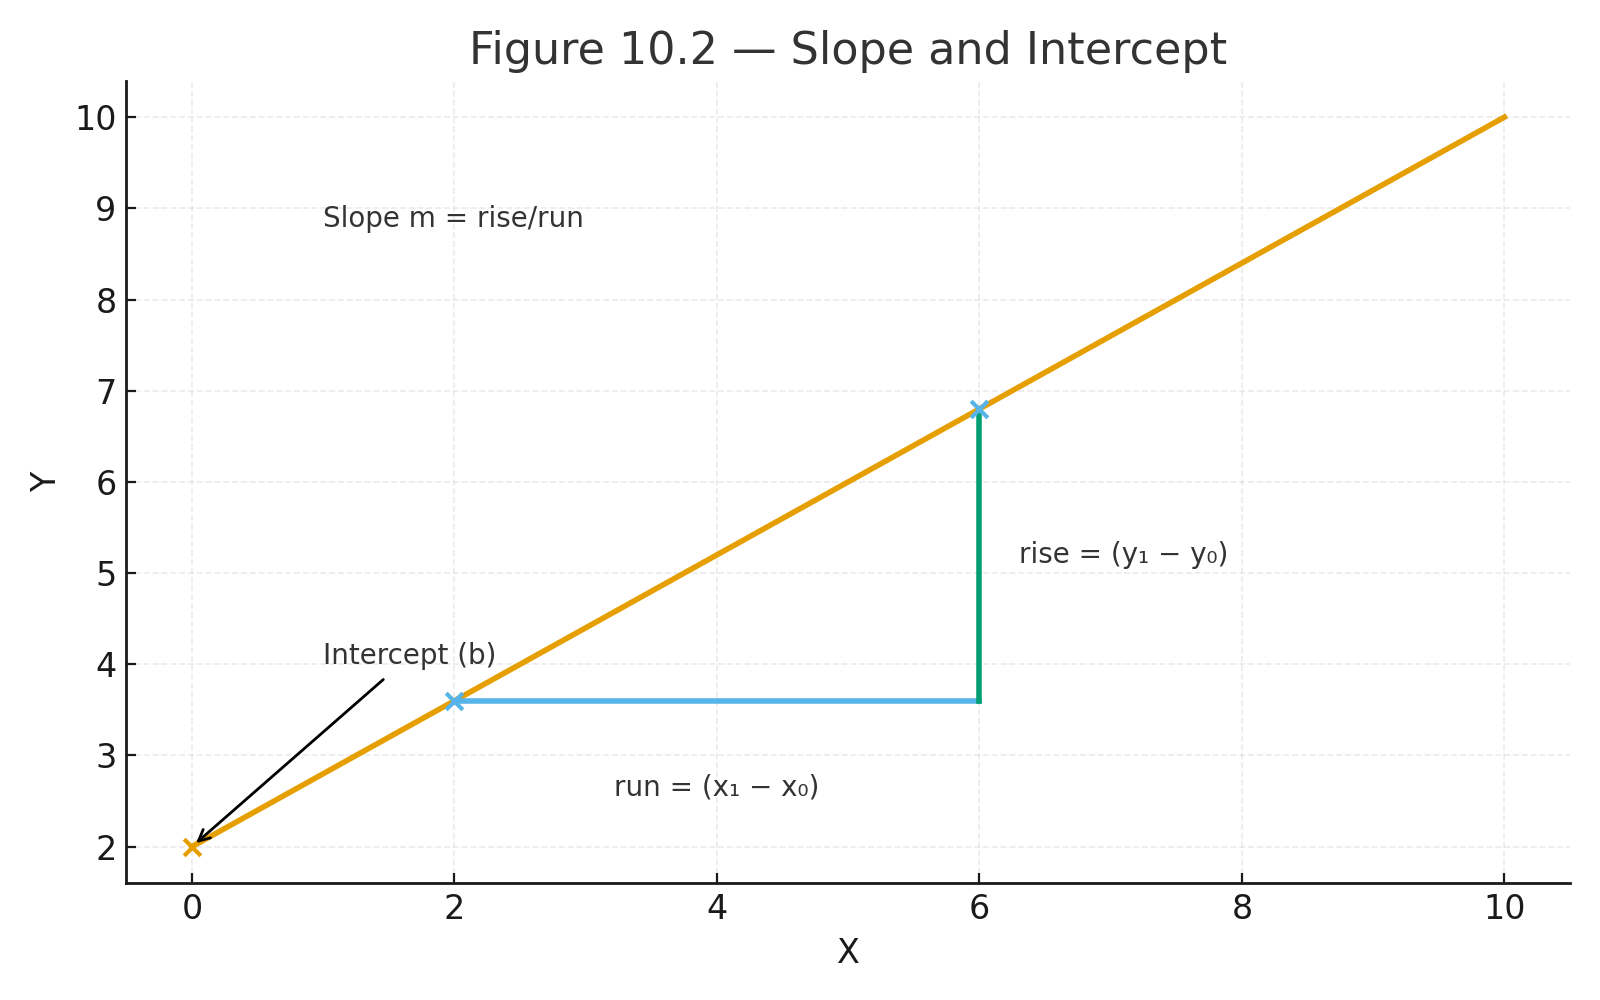
Figure 10.2 — Illustration of slope (rise/run) and intercept.
Why This Matters
Regression is a predictive tool.
It connects statistical description to practical forecasting: how much outcome (Y) changes with predictor (X).
It is the basis for more advanced models used in science, business, and data analysis.
Practice self-test quiz
In the space below, please find practice problems and self-test quizzes. For full access, please signup free.