

Appendix 5 — Technology Tips (On Your Phone & Laptop)
Statistics can be done with calculators, spreadsheets, or software. Here’s a quick guide.
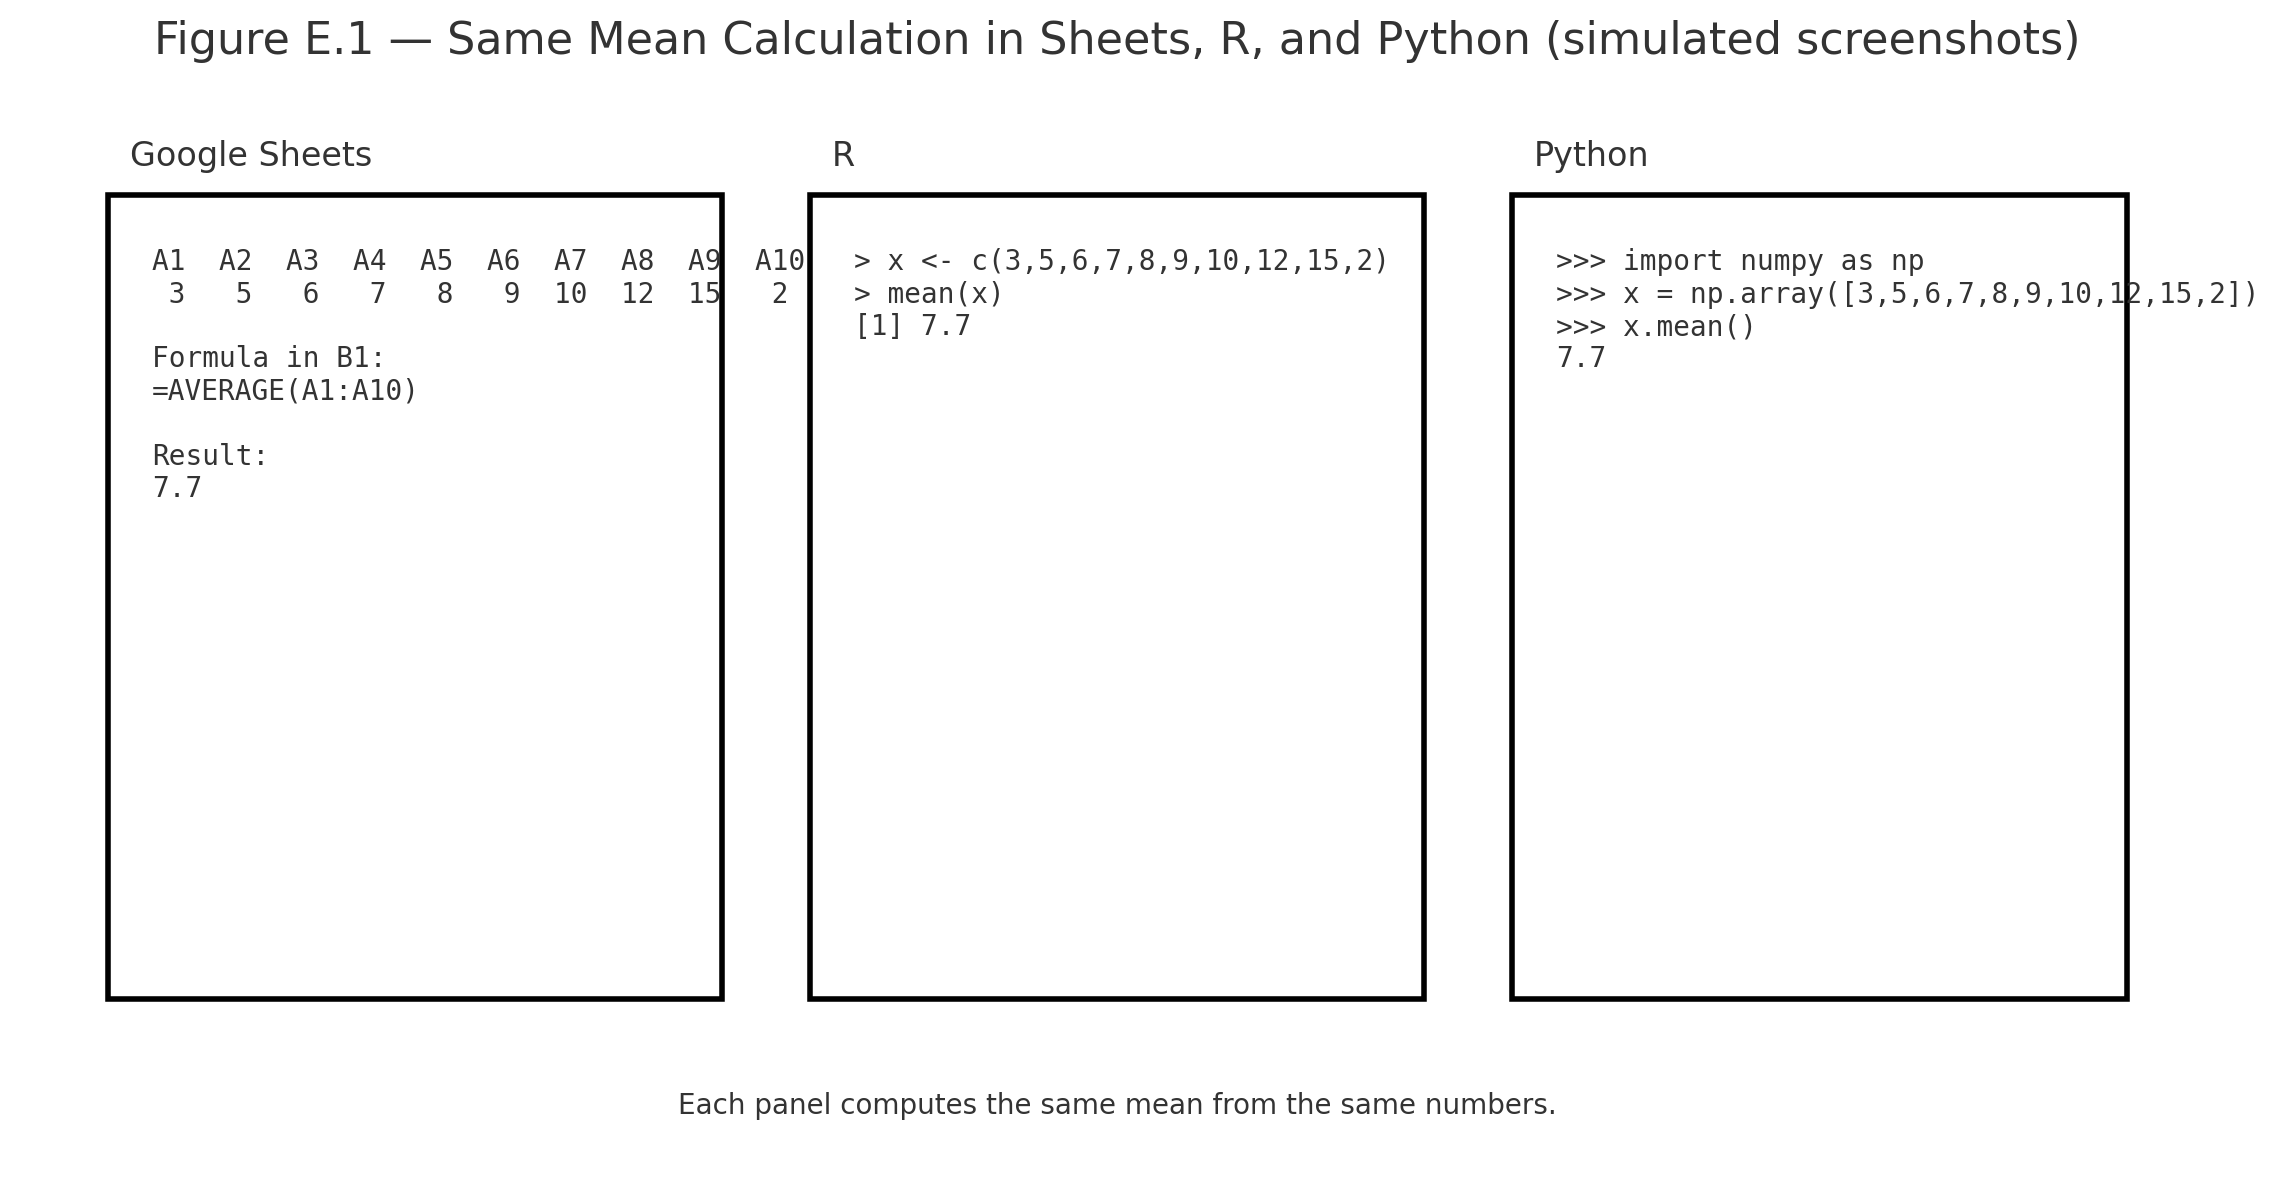
Excel / Google Sheets
| Task | Formula | Example |
|---|---|---|
| Mean | =AVERAGE(A1:A10) | Mean of scores in A1–A10 |
| Standard Deviation | =STDEV.S(A1:A10) | Spread of scores |
| t-test | =T.TEST(A1:A10,B1:B10,2,2) | Compare two groups |
R (RStudio or RStudio Cloud)
| Task | Command | Example |
|---|---|---|
| Mean | mean(x) | mean(c(6,8,10)) = 8 |
| SD | sd(x) | sd(c(6,8,10)) = 2 |
| t-test | t.test(x,y) | Compare two groups |
Python (NumPy / SciPy / Pandas)
| Task | Command | Example |
|---|---|---|
| Mean | np.mean(x) | np.mean([6,8,10]) = 8 |
| SD | np.std(x, ddof=1) | np.std([6,8,10],ddof=1) = 2 |
| t-test | stats.ttest_ind(x,y) | Compare two groups |
iPhone Calculator
- Rotate sideways → scientific mode
- Use √ for square root
- Parentheses matter: type numerator, then divide by denominator
- Fine for small problems, but not for full datasets
Summary
- For quick homework: iPhone calculator
- For assignments: Excel / Google Sheets
- For coding: Python (Colab) or R (RStudio Cloud)
📱 QR: Open sample data in Google Sheets (ready to practice mean, SD, t-test)
Visuals
Figure E.1 — Screenshots of the same mean calculation in Sheets, R, and Python side by side.
Practice self-test quiz
In the space below, please find practice problems and self-test quizzes. For full access, please signup free.