

We have already developed the
concept of independence. In those
experiments in which each subject
is used only in one group or
condition, we say that the groups
are independent. So far in this
book we have considered only
independent-groups statistical
designs and experiments.
In designs in which the groups are
not independent, a subject is used
in more than one group or treatment.
That is, each subject experiences
more than one treatment.
For example, John may first be
given behavioral therapy, and
later, several months later, he may
also be given psychoanalytic
therapy. The effects of the two
therapies are then compared.
A variation of this arrangement is
to match each subject with
another subject on the basis of
similarity in some measure. This is
done to eliminate carryover effects
that may, obviously, be present in
giving one subject both treatments.
There are obviously advantages
and disadvantages in choosing
matched groups designs over
independent groups designs.
However, this issue is beyond the
goals of the present book. In
general, independent groups
designs are safer, and should, in
my opinion, be preferred.
The concepts in matched groups
designs are the same as those in
independent groups designs. We
will, therefore, confine ourselves to
giving examples of these designs.
First an example for t-test, and
then an example for ANOVA
repeated measures.
An example of t-test for
matched groups
In comparing two new anti-anxiety
drugs, a pharmaceutical company
selected 5 pairs of patients, each
pair matched on the basis of their
anxiety score.
Here is the layout and data of the
experiment.
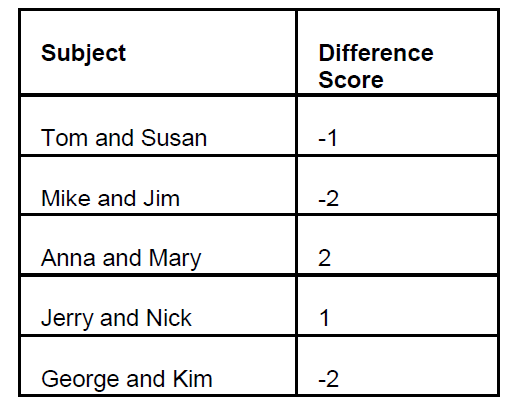
Mean for difference=0.4
The formula for the t-test for
dependent groups is

We read it as follows:
t for paired observations equals
mean of differences divided by the
standard deviation over the square
root of the n. (The standard
deviation divided by the square
root of the n is the standard error
of the mean, SEM, remember?)
You know all of the terms of the
t-formula. You also recognize that it
is the same old story, our old
friend, the z formula.
t=+0.49 df=4
Entering the t-table with df 10 we
find that the required t=2.132
Our obtained t 0.49 is smaller
than the required, therefore we do
not have significance. We say that
the difference we observed is not
significant (p>0.05).
Study the table below..
It adds to our effort toward integration
and understanding beyond a mechanistic
use of a plethora of formulas.
Study the table below..
It adds to our effort toward integration
and understanding beyond a mechanistic
use of a plethora of formulas.


Example of ANOVA Repeated
Measures
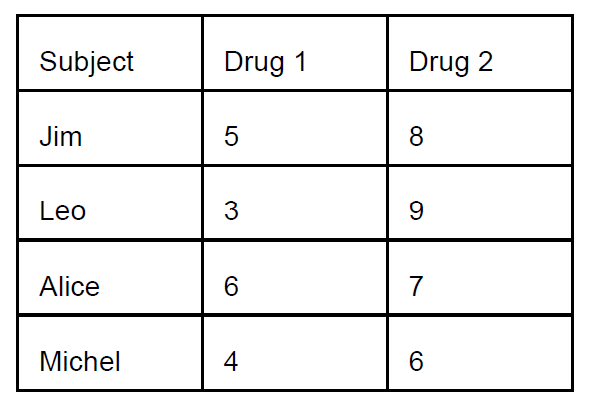
Four patients with damage in the
hippocampus were treated with
two new drugs in order to see if
their memory improved.
Here is the layout as well as the
scores of the experiment. High
scores indicate improvement in
memory.
ANOVA SUMMARY TABLE
Repeated Measures
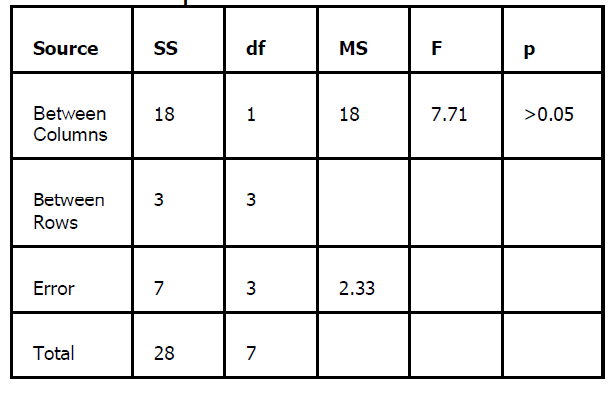
Entering the F table in Appendix
with df 1 and 3, we find an F of
10.12. This is the required F in
order to have significance. Our
obtained F (see ANOVA summary
table above) is 7.71. It is less than
the required F, therefore, we do
not have significance. We say:
There was no significant difference
between the means of the two
conditions (p>0.05).
P greater than point o five.
I see there are questions.
What is Between Columns? You ask.
It is the usual Between variance
that you know. The variance that
our treatments produce. The
variance of the means.
What is Between Rows? you ask.
If you look at the layout above,
you see that the rows are subjects,
one subject per row. The mean of
each subject is the mean of each
row. The variance of these means
are the variance between the
rows.
Why you did not calculate an F for
the Rows? you ask.
There is no reason that I can think
of, that would justify my wanting to
know whether there is a statistical
significant difference between
subjects. That would be an
absurd statement.
Once again you see that our
conceptual approach allowed us to
attack this design too, without the
need for new formulas. What is of
course more important is the fact
that we understand the logic of this
design too. We feel in command,
comfortable to handle any issue.