

Drama
A Cap for Wisconsin Farmers
Mike got his degree in Psychology from
UW Madison. Given the large number of
psychology graduates and also his doubts
regarding his suitability for psychology
practice, he found a job as a consultant
with the State of Wisconsin. Psychologists,
you should know, learn a lot of statistics.
Around the middle of last November, his
boss walked into his office and said:
Mike, I have a job for you. The governor
has decided to give a present to all
farmers in the State of Wisconsin because
they are very angry with the new taxes.
The gift will be a woolen cap. We want to
know the size of the cap. If we can find
the average head size of Wisconsin
farmers, we can give the order to a factory
in Milwaukee to make the caps. They are
woolen so they naturally stretch. If we
know the average head size we will be ok.
Since we only have one month to
complete this project, I expect you to
report to me with a plan and budget
tomorrow.
Early the next morning Mike walked into
his boss’s office and handed him the
proposal. Three hundred personnel to
cover the entire state, to locate every
farmer, in one weak. Fifty 4x4 Jeeps to
safely travel to even the remotest towns.
One small aircraft to land in the northern
towns in case of snow. Three hundred
laptops. Ten German Shepherds to smell
the bears up and around Wausau. Budget.
$30,000.00.
His boss looked at Mike for 20 seconds
speechless. Then, in a completely
unemotional voice, he said:
Mike, in the State of Wisconsin we are
very careful with our money. No way. Find
a less expensive way by tomorrow.
Mike began to fear for his job. All day in
his office, all night in his home, he
scratched his head, drank a lot of coffee,
and prayed to Goddess Normal Curve.
I am not allowed to measure all farmer
heads. That is too expensive. I can,
perhaps, still find a way to use the normal
curve. If I can come up with a mean that
has a strong probability to be close to the
real mean… If I take measures of the
heads of many farmers and compute the
mean…. Can I be sure that this is close to
real mean? If not, I will lose my job. So,
what if I go out a second time and repeat
the data collection, just to make sure that
this mean was not a mean that I got by
chance but it was a mean close to the real
mean. Ah, that might be it! I go out
several times and each time I compute the
mean. In the end I graph these means (as
though they were scores).
Then I use the normal curve to reason
in some way. How? Let me see… The
normal curve would be graphing
means. So, the mean would be the
mean of the means. Can I play the
game of Nick? He was making
probability statements, predictions,
regarding the occurrence of scores,
using the standard deviation of the
scores. Ah! I can use the standard
deviation of the means. Then I can
reason, like Nick, that a mean close to
the mean of means, that is between
standard deviation -2 and +2 would
have a high probability of occurrence.
That’s it!
He prepares the budget, and early in
the morning he busts into his boss’s
office.
It will cost us $10,000, he says.
Good idea, but too expensive.
Tomorrow is the last day, boss says,
and with the palm of his hand he
points at the door.
Three in the morning, Mike is on his knees
in front of Goddess Normal Curve, buried
in statistics books and statistics journals,
and notes from his stat class. Suddenly he
comes across an article in a journal which
claims that you can calculate an estimate
of the standard deviation of the normal
curve that would be graphing means.
…that would be graphing means... Would
be…, he repeats this several times.
Would be, because this curve has only one
mean. Let me say it in another way. You
go out and you collect data from a large
sample. You can calculate an estimate of
the standard deviation of the curve that
would be graphing the means of samples
that you would be getting if you were
allowed to collect several samples.
Weird…, Mike mumbles. What good is it?
I want to be able to collect one sample,
calculate the mean, and tell my boss that
we can trust this mean as being close to
the real head size of Wisconsin farmers,
that it is reliable. What good is computing
an estimate of the standard deviation of a
curve and not know much else about this
curve…
The traffic noise picks up, it is six o’clock
in the morning. Another look at the
Goddess, and a supplication for
inspiration.
All I know is what Nick did, Mike says. He
placed the mean of his data on the normal
curve mean (middle). Unfortunately, I do
not have the mean of the means, since I
am allowed to take only one mean. Let me
place the letters TM in the middle of the
normal curve, TM for True Mean. TM will
remain forever unknown. Pretty spooky.
But I can place the standard deviation of
this “I-would-be-getting” curve, an
estimate of the standard deviation, to be
exact.
Ok, then what.
Weird things happen to people under
stress and in despair. Some people hear
voices, others are visited by angels,
others write poetry…
Got it! he suddenly exclaims, raises the
normal curve over his head, and dances a
cannibal dance around his desk.
Eight in the morning he rushes into his
Boss’s office.
One day, one sample, one mean, one
thousand dollars! he yelps.
His boss pretends he is not listening.
I will go out, one day, collect many head
size scores, calculate this mean. Next, I
will compute an estimate of the standard
deviation of this curve that you did not
allow me to get the data for. I will then
run down two standard deviations from
the middle of the curve (-2 to +2).
Mike pauses to get some feedback from
his boss. Stone silence.
Grant me this, Mike continues in a loud
voice. This curve would be graphing
means, right? My one mean is one of
these means, right?
That is absolutely correct, and also
tautologous, boss says, and looks at Mike
with contempt.
What is the chance that this mean
would be one of the 95 percent of
the means? Mike asks.
It’s highly probable, almost certain
boss replies.
Then the problem boils down to the
size of the standard deviation of
this curve, i.e., the estimate that we
will compute. If the standard
deviation is large, then we would
run the risk of producing caps that
are ridiculously large or small for
the heads of Wisconsin farmers. If
the standard deviation is small, our
mean would almost certainly be
close to the true mean, and we are
in business.
Mike carried out this project
successfully without any problems,
except that he was chased by a
playful bear at Wausau up north.
The formula for the calculation of
the estimate of the standard
deviation of the curve that we
would be getting if we were
allowed to get many samples, but
are allowed only to take one
sample, and so have only one
mean, is:
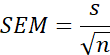
We read this as follows: standard
error of the mean equals the
standard deviation (of the data
from our one sample), divided by
the square root of the number of
data that go into the calculation,
i.e., the n. Yes, you guess right, the
official name for the estimate of
the standard deviation of the curve
that would be graphing means is
called standard error of the mean.