Appendix 8 — Glossary of Key Terms

Mean (average)
Sum of all scores divided by number of scores.
Example: (6 + 8 + 10) / 3 = 8.

Median
Middle score when data are ordered.
Example: For [5, 7, 8], median = 7.

Mode
Most frequent score.
Example: For [2, 3, 3, 5], mode = 3.

Variance (s²)
Average squared deviation from the mean.

Standard Deviation (s)
Square root of variance. Spread of scores around the mean.

Standard Error of the Mean (SEM)
How much sample means vary.
Formula: $$SEM = \frac{s}{\sqrt{n}}$$

t-test
Compares two means.

ANOVA (F-test)
Compares three or more means.

Post Hoc Test
Used after ANOVA to find which groups differ.

Correlation (r)
Strength and direction of a linear relationship. Range: –1 to +1.

Regression
Equation that predicts Y from X.
Example: $$\hat{Y} = a + bX$$

Chi-square (χ²)
Test for categorical data (counts).

Degrees of Freedom (df)
Independent pieces of information in a test.

p-value
Probability of getting the observed result (or more extreme) if the null hypothesis is true.


📱 QR: Interactive glossary (search symbols, formulas, definitions)

Practice self-test quiz

In the space below, please find practice problems and self-test quizzes. For full access, please signup free.

Appendix 7 — Study Tips for Statistics

Learning statistics is not about memorizing formulas — it’s about thinking with data.
Here are some strategies to make it easier.


1. Read Formulas in Two Ways

  • Symbolic: $$\bar{X} = \frac{\Sigma X}{n}$$
  • Words: “Mean = sum of scores / number of scores”

2. Practice by Hand First

  • Work out a mean or variance with a small dataset.
  • Then check with calculator/Excel.
  • This builds intuition and confidence.

3. Draw Pictures

  • Normal curve with shaded area
  • Bar charts for group means
  • Scatterplots for correlation
    Visuals make ideas stick.

4. Watch Out for Common Mistakes

  • Mixing up SD and SEM
  • Forgetting to subtract 1 for df
  • Using a one-tailed test when two-tailed is needed

5. Use Short Sessions

  • 10–15 minutes of practice each day beats one long cram.
  • Try one formula or test per session.

6. Check Your Understanding

  • Can you explain in words what the test does?
  • Example: “t-test compares two means. ANOVA compares three or more.”

📱 QR: Online flashcards + short quiz (practice key terms & formulas)


Practice self-test quiz

In the space below, please find practice problems and self-test quizzes. For full access, please signup free.

Appendix 6 — Data Sets for Practice

spreadsheet dataset

```html

Appendix 6 — Data Sets for Practice

Working with real numbers is the best way to learn statistics. This appendix provides small “mini datasets” you can analyze by hand (or with a calculator), plus larger files for practice with spreadsheets.


Dataset Provenance (Read This First)

  • Pedagogical = small, simplified numbers chosen to make learning and checking easier.
  • Simulated = computer-generated numbers designed to resemble real data (not collected from real people).
  • Empirical = collected from real observations (only used if explicitly stated).

Note: Unless a dataset is explicitly labeled Empirical, you should treat it as Pedagogical or Simulated practice data.


Mini Datasets (In-Page)

1) Quiz Scores

Provenance: Pedagogical
n: 10
Scale: Ratio (points)
Data: 6, 7, 8, 9, 10, 7, 8, 6, 9, 10

  • Suggested Lessons:
    • Lesson 2 — The Averages: mean, median, mode
    • Lesson 3 — Variance & Standard Deviation: variance, SD, z-scores
    • Lesson 4 — The Standard Normal Curve: interpret z-scores (as a bridge)
  • Check values (optional): Mean = 8.0; sample SD ≈ 1.49 (population SD ≈ 1.41)

2) Reaction Times (ms)

Provenance: Pedagogical (human-like values)
n: 8
Scale: Ratio (milliseconds)
Units: ms
Data: 220, 250, 270, 230, 260, 280, 240, 300

  • Suggested Lessons:
    • Lesson 3 — Variance & Standard Deviation: spread, outliers, SD
    • Lesson 6 — The t-test: use as a template dataset (e.g., compare two conditions by splitting into two groups)
    • Lesson 7 — ANOVA: extend to 3+ groups by creating conditions
  • Instructor tip: reaction time data often show mild skew in real life. If you want skew, see the larger practice files below.

3) Stress Reduction Scores (Three Groups)

Provenance: Pedagogical (grouped scores)
Scale: Interval/Ratio (score units; treat as interval for ANOVA practice)
Groups:

  • Meditation (n = 3): 65, 70, 72
  • Exercise (n = 3): 68, 71, 75
  • Music (n = 3): 75, 78, 82
  • Suggested Lessons:
    • Lesson 7 — ANOVA: one-way ANOVA (three independent groups)
    • Lesson 8 — Post Hoc Tests: follow-up comparisons after ANOVA (conceptual)
    • Lesson 13 — Degrees of Freedom Cookbook: df for one-way ANOVA
  • Important note: The sample sizes are intentionally small for learning mechanics. In real studies, groups are usually larger.

Larger Practice Datasets (Download Files)

These datasets are designed for spreadsheet work, graphing, and full problem sets.

  • Exam Scores (n = 100)
    Provenance: Simulated
    Suggested Lessons: Lesson 4 (normal curve), Lesson 5 (SEM), Lesson 6 (t-test foundations)
  • Survey Data (preferences by gender/age)
    Provenance: Simulated (categorical practice)
    Suggested Lessons: Lesson 12 (chi-square), Lesson 1 (why statistics matters in decisions)
  • Simulated Medical Trial (treatment vs. control, repeated measures)
    Provenance: Simulated (instructional “trial-style” dataset; not clinical research)
    Suggested Lessons: Lesson 6 (t-test concepts), Lesson 7 (variance partitioning concepts), and for advanced learners: repeated-measures ideas (optional)

Downloads: CSV and Excel files are provided via the QR code(s) on this page (and/or direct links, if enabled on your device).

Reproducibility note (simulated files): If you revise these datasets in future editions, consider generating them with a fixed random seed so instructors and students can reproduce results across versions.


Trusted External Sources (Optional)

If you want additional datasets beyond the practice files above, the following repositories are widely used for learning and benchmarking:

  • NIST Statistical Reference Datasets (SRD)
    High-quality benchmark datasets for practice and verification (excellent for checking calculations and software).
  • UCI Machine Learning Repository
    Larger, more complex datasets. Recommended only for advanced students or enrichment projects.

Visual Reference

Figure F.1 — Example spreadsheet view of a dataset (columns such as ID, Score, Group). Use this as a template for organizing your own data before running calculations.


Self-Test Quiz Access

Practice problems and self-test quizzes may appear below. If full access is restricted, please sign up (free) to unlock the quiz section.

```
Appendix 5 — Technology Tips (On Your Phone & Laptop)

mean across tools

Statistics can be done with calculators, spreadsheets, or software. Here’s a quick guide.


Excel / Google Sheets

TaskFormulaExample
Mean=AVERAGE(A1:A10)Mean of scores in A1–A10
Standard Deviation=STDEV.S(A1:A10)Spread of scores
t-test=T.TEST(A1:A10,B1:B10,2,2)Compare two groups

R (RStudio or RStudio Cloud)

TaskCommandExample
Meanmean(x)mean(c(6,8,10)) = 8
SDsd(x)sd(c(6,8,10)) = 2
t-testt.test(x,y)Compare two groups

Python (NumPy / SciPy / Pandas)

TaskCommandExample
Meannp.mean(x)np.mean([6,8,10]) = 8
SDnp.std(x, ddof=1)np.std([6,8,10],ddof=1) = 2
t-teststats.ttest_ind(x,y)Compare two groups

iPhone Calculator

  • Rotate sideways → scientific mode
  • Use √ for square root
  • Parentheses matter: type numerator, then divide by denominator
  • Fine for small problems, but not for full datasets

Summary

  • For quick homework: iPhone calculator
  • For assignments: Excel / Google Sheets
  • For coding: Python (Colab) or R (RStudio Cloud)

📱 QR: Open sample data in Google Sheets (ready to practice mean, SD, t-test)


Visuals

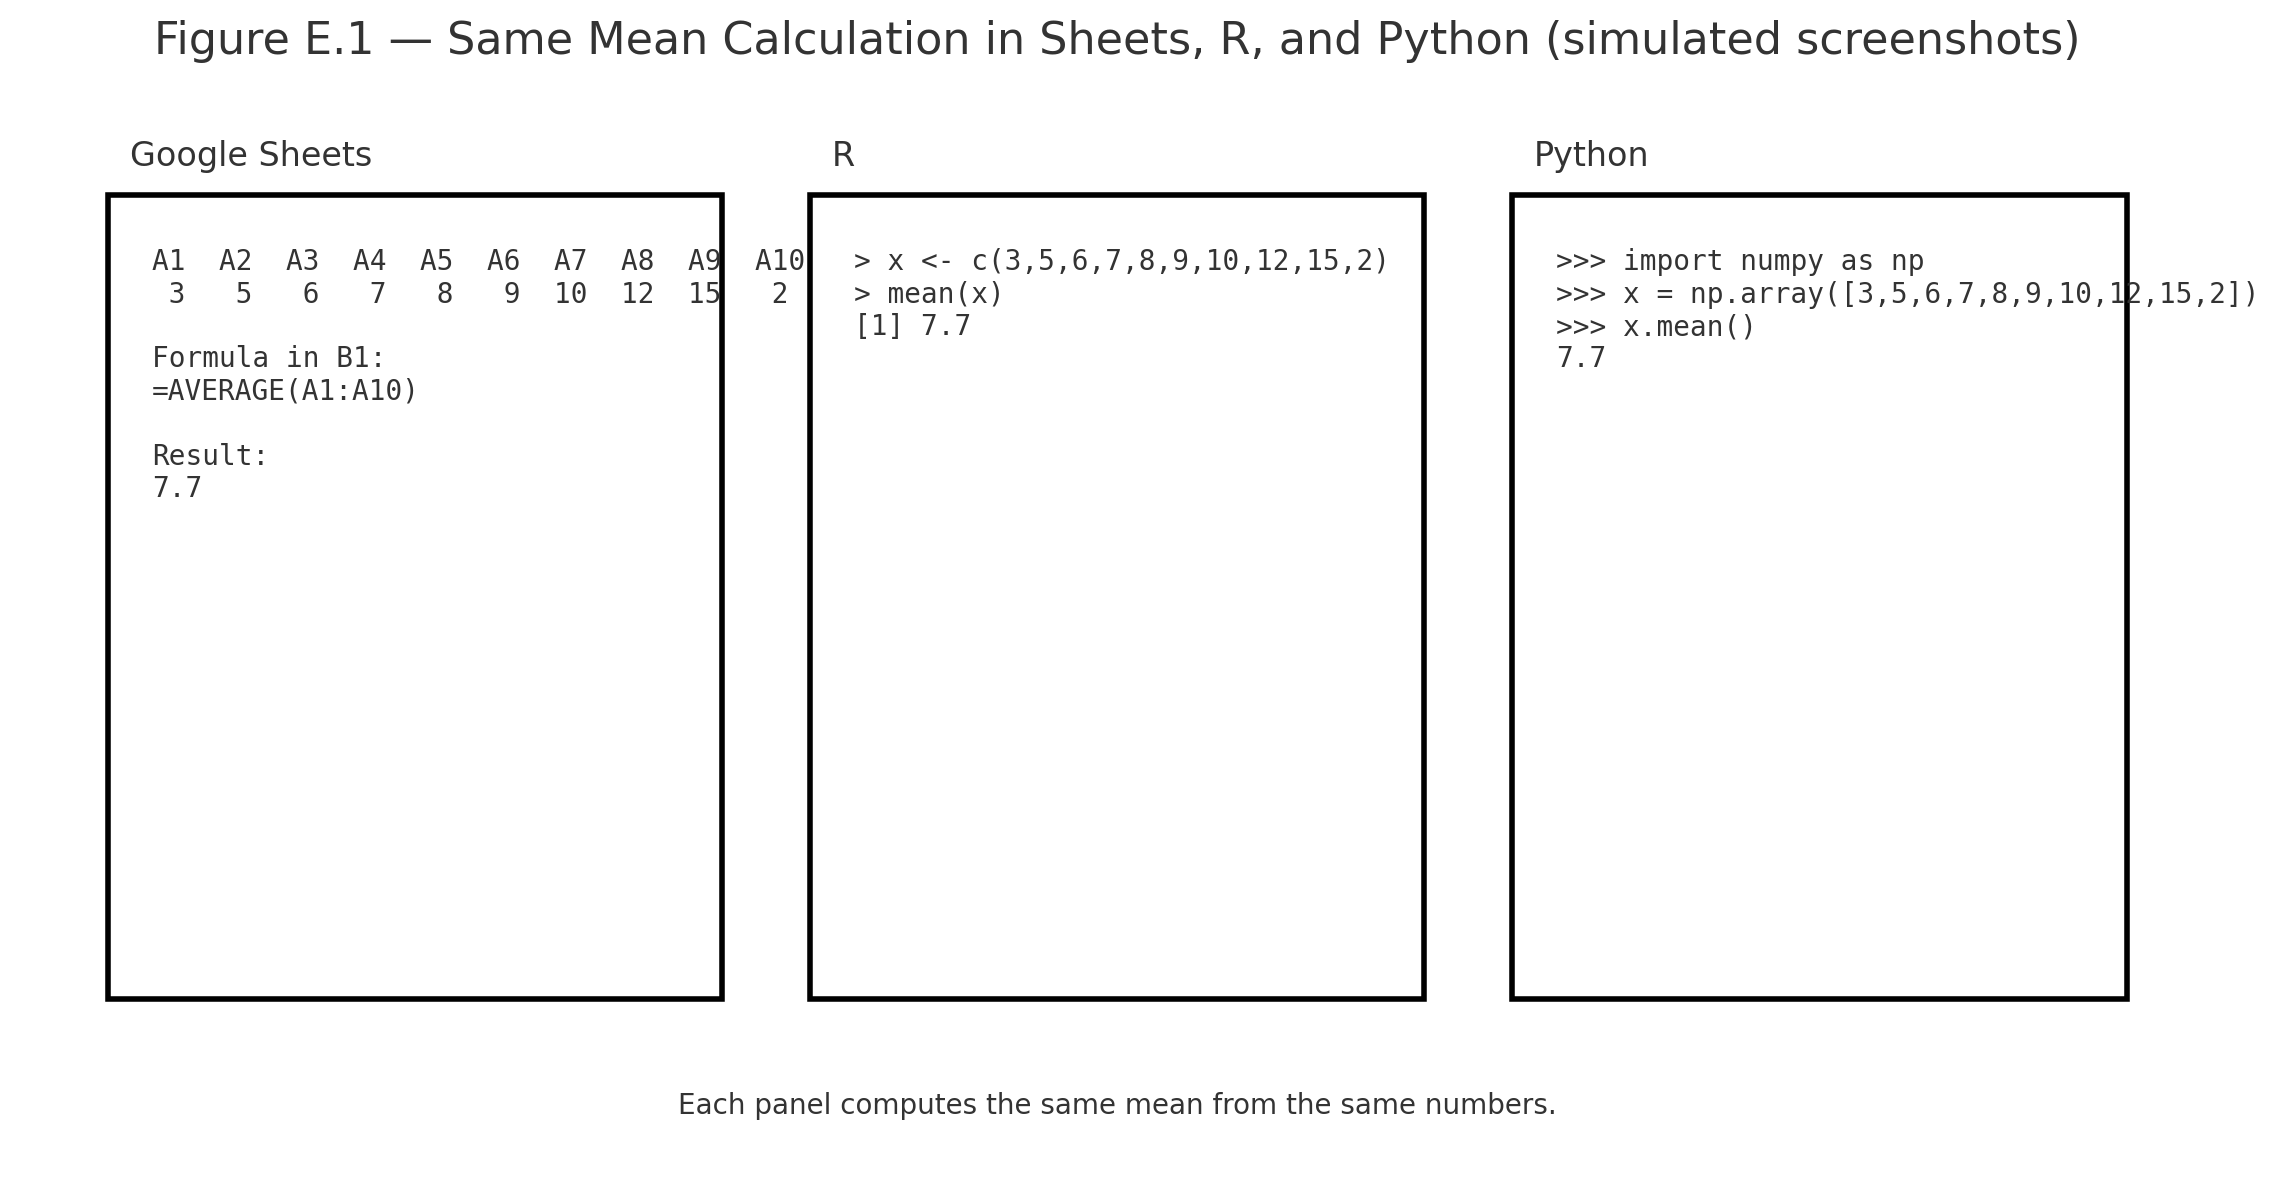
Figure E.1 — Screenshots of the same mean calculation in Sheets, R, and Python side by side.

Practice self-test quiz

In the space below, please find practice problems and self-test quizzes. For full access, please signup free.

Appendix 4 — Using the z-table

Using the z-table
Area Left of z = 1.00
area Between Two z-values

The z-table gives areas (probabilities) under the standard normal curve (mean $$\mu=0$$, SD $$\sigma=1$$).
Use it after you standardize a score:

Standardization (z-score):
$$z=\frac{x-\mu}{\sigma}$$
In words: $$z=\frac{\text{score} - \text{mean}}{\text{standard deviation}}$$


What the z-table shows

Most tables list the area to the left of a z value (cumulative probability).

  • Left area at $$z=0$$ is 0.5000 (half the curve).
  • Far left (negative big z) approaches 0; far right (positive big z) approaches 1.

Quick recipes

1) Probability below a score (left tail)
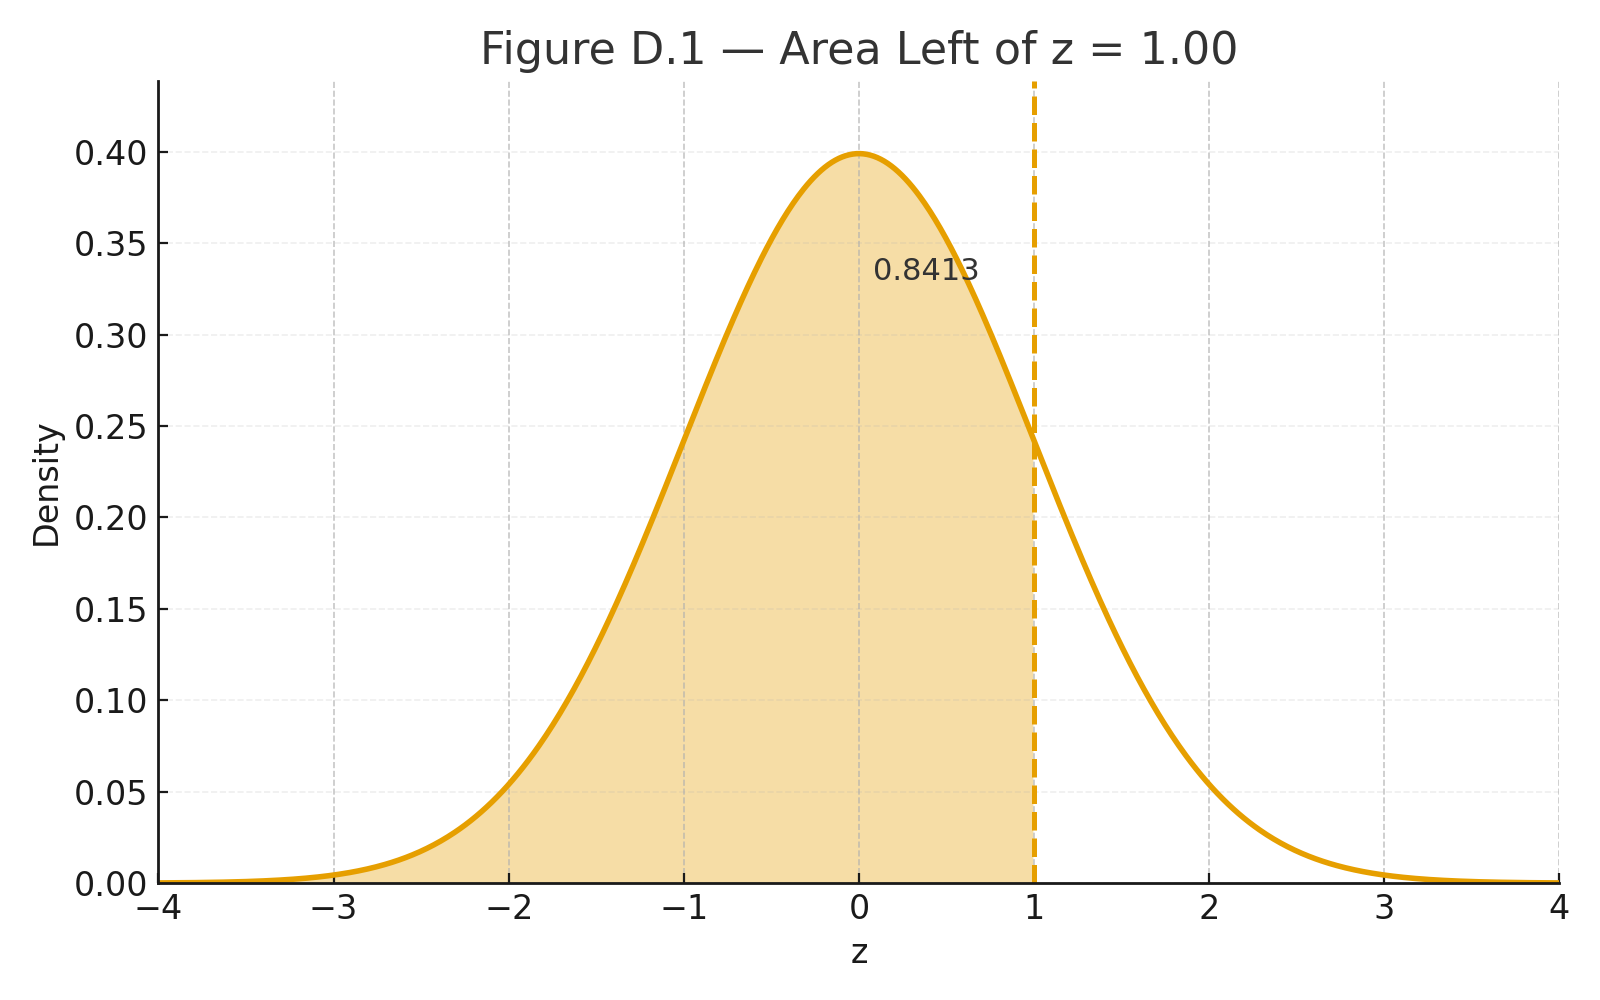
Example: $$z=1.00$$ → table gives 0.8413.
Interpretation: $$P(Z \le 1.00)=0.8413$$ (84.13% below).

2) Probability above a score (right tail)
Use complement: $$P(Z \ge z)=1-\text{left area}$$.
Example: $$z=1.00 \Rightarrow P(Z \ge 1.00)=1-0.8413=0.1587.$$

3) Probability between two scores
Subtract left areas.
Example: between $$z= -0.50$$ (left area 0.3085) and $$z=1.20$$ (0.8849):
$$P(-0.50 \le Z \le 1.20)=0.8849-0.3085=0.5764.$$

4) From a raw score to probability
Test scores: $$\mu=100, \ \sigma=15$$. What % are below 115?
Standardize: $$z=\frac{115-100}{15}=1.00 \Rightarrow 0.8413 \ (\text{84.13%}).$$

5) From probability to raw score (percentile)
What score is the 90th percentile?
Find z with left area ≈ 0.9000 → $$z \approx 1.2816$$.
Convert back: $$x=\mu+z\sigma=100+(1.2816)(15)=119.22.$$


Tips

  • For negative z, use the table’s symmetry: left area at $$-z$$ equals 1 − left area at $$+z$$.
  • Rounding: two decimals is common (e.g., 1.23).
  • Modern tools (calculator/Sheets/Python) can give exact p-values directly.

Visuals

Figure D.1 — Normal curve with area left of z = 1.00 shaded (0.8413).
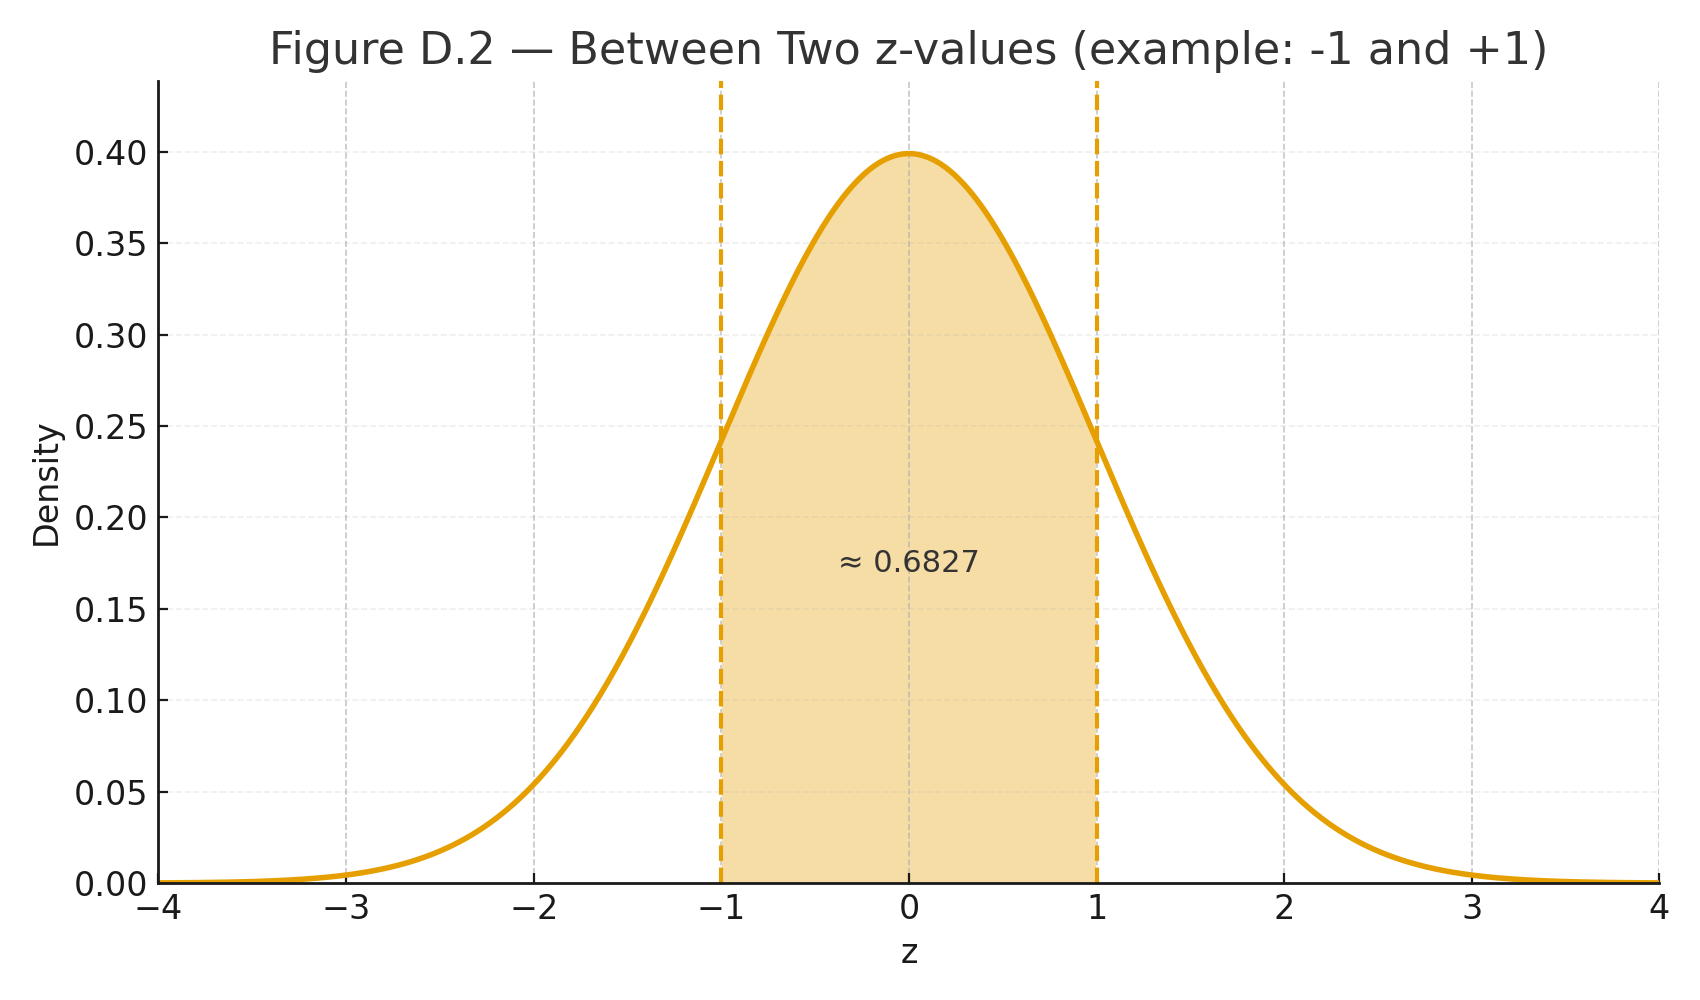
Figure D.2 — Two-z shaded band for “between” probability.


📱 QR: Online z-calculator (type z or x, get areas instantly)

Practice self-test quiz

In the space below, please find practice problems and self-test quizzes. For full access, please signup free.

Appendix 3 — Using the t-table and F-table

Online z-calculator (type z or x, get areas instantly)
F2,21
t-df22,0.01

Tables give the critical values we compare our test statistic against.
They depend on:

  • The significance level (α, often 0.05)
  • The degrees of freedom (df)

t-table

  • Rows = degrees of freedom (df)
  • Columns = significance level (α)

Example:

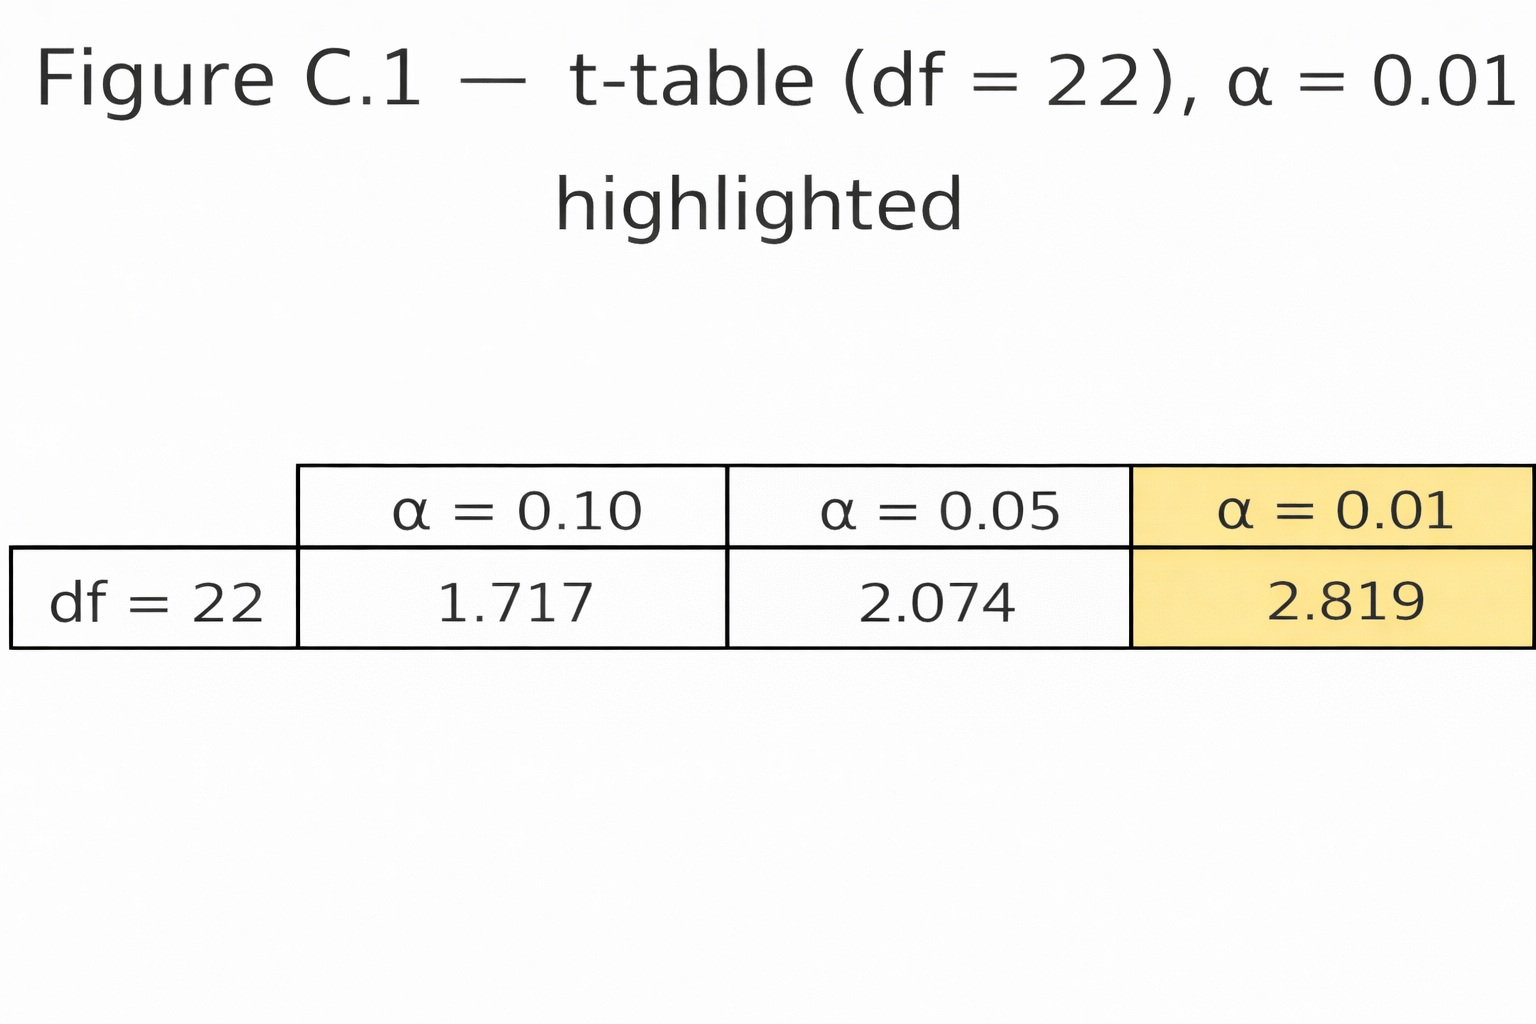
  • Independent-samples t-test with n₁ = 12, n₂ = 12
  • df = 12 + 12 – 2 = 22
  • At α = 0.05 (two-tailed) → critical t ≈ 2.07
  • If $$|t| \geq 2.07$$ → significant

F-table

  • Needs two df values:
    • df between (numerator)
    • df within (denominator)

Example:

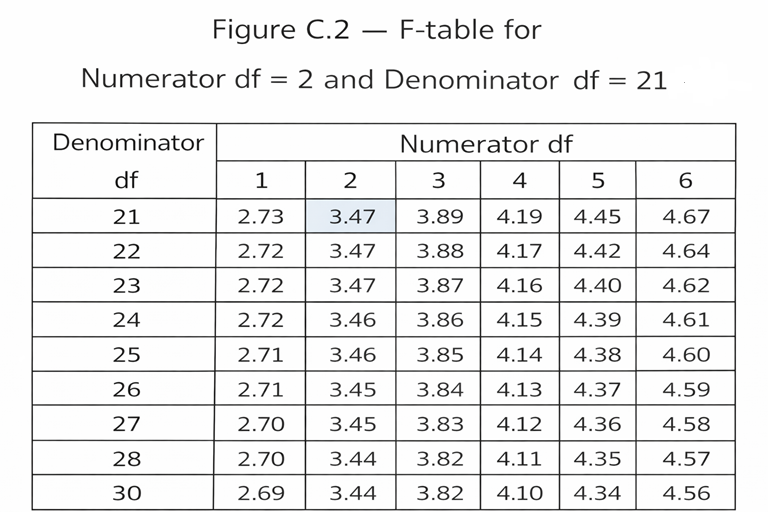
  • One-way ANOVA, 3 groups, N = 24
  • df between = k – 1 = 2
  • df within = N – k = 21
  • At α = 0.05 → critical F ≈ 3.47
  • If computed F ≥ 3.47 → significant

Student Tips

  • Always compute df correctly.
  • Use tables if no software is available.
  • Most calculators or apps today give exact p-values — faster than tables.

📱 QR: Interactive critical value calculator (t and F tables online)


Visuals

Figure C.1 — Snippet of a t-table row (df = 22, α = 0.05 highlighted).
Figure C.2 — F-table grid with numerator df = 2, denominator df = 21 marked.


Practice self-test quiz

In the space below, please find practice problems and self-test quizzes. For full access, please signup free.

Appendix 2 — Math Review for Statistics

Algebra refresher video (scan for a quick math warm-up)

A quick refresher on the math you’ll need in this book.


Order of Operations (PEMDAS)

  • Parentheses → Exponents → Multiplication/Division → Addition/Subtraction
  • Example:
    $$3 + 2 \times (4^2) = 3 + 2 \times 16 = 35$$

Fractions and Division

  • Example:
    $$\frac{24}{6} = 4$$

Square Roots

  • Example:
    $$\sqrt{9} = 3$$
  • Example:
    $$\sqrt{\frac{16}{4}} = \sqrt{4} = 2$$

Summation Notation (Σ)

  • Means “add them up.”
  • Example:
    $$\Sigma X = 2+5+7 = 14$$
  • Example:
    $$\bar{X}=(2+5+7)/3=14/3,\quad \Sigma (X-\bar{X})^2=(2-14/3)^2+(5-14/3)^2+(7-14/3)^2=38/3\approx12.67$$

Exponents and Squares

  • $$x^2 = x \times x$$
  • Example:
    $$5^2 = 25$$

Mini Example: Variance and Standard Deviation

Data: 6, 8, 10

  1. Mean:
    $$\bar{X} = \frac{6+8+10}{3} = 8$$
  2. Deviations: –2, 0, +2
  3. Squared deviations: 4, 0, 4
  4. Variance:
    $$\frac{8}{2} = 4$$
  5. Standard deviation:
    $$\sqrt{4} = 2$$

📱 QR: Algebra refresher video (scan for a quick math warm-up)

Practice self-test quiz

In the space below, please find practice problems and self-test quizzes. For full access, please signup free.

Part 7 --- Appendices

Welcome to Part 8 — Appendices of this free online high school statistics textbook. This essential reference section provides quick-access cheat sheets, reviews, statistical tables, technology tips, and supporting resources to help you throughout the course. From symbols and notation to probability tables, math refreshers, practice datasets, study strategies, and a comprehensive glossary, these appendices are designed as reliable tools for high school students, AP Statistics preparation, and anyone needing clear statistical references.

Perfect for quick lookups during homework, exam review, or practical applications, Part 8 complements the main lessons with statistical tables, formula references, technology guidance, and study support—all presented in a clear, accessible format to build confidence in descriptive and inferential statistics.

Appendices in Part 8

  1. Appendix 1 — Symbols and Notation (Cheat Sheet) – Quick reference for common statistical symbols, Greek letters, and notation used throughout the book.
  2. Appendix 2 — Math Review for Statistics – Review of essential algebra, summation notation, and foundational math skills needed for statistics.
  3. Appendix 3 — Using the t-table and F-table – Guidance on reading and applying t and F distribution tables for hypothesis testing.
  4. Appendix 4 — Using the z-table – Step-by-step instructions for the standard normal (z) table and probability calculations.
  5. Appendix 5 — Technology Tips (On Your Phone & Laptop) – Practical guidance for calculators, spreadsheets, statistical software, and mobile tools.
  6. Appendix 6 — Data Sets for Practice – Real and simulated datasets for hands-on learning and concept reinforcement.
  7. Appendix 7 — Study Tips for Statistics – Effective strategies for learning, reviewing, and succeeding in statistics courses.
  8. Appendix 8 — Glossary of Key Terms – Clear definitions of essential statistical vocabulary from descriptive through inferential statistics.
  9. Appendix 9 — The Normal Distribution Table – The standard normal (z) table for probability lookup and interpretation.
  10. Appendix 10 — The t table – Critical values of the t distribution for confidence intervals and hypothesis tests.
  11. Appendix 11 — The F-table – F distribution tables used in ANOVA and variance-based hypothesis testing.

These appendices are designed to function as quick-reference tools you can return to again and again. Use them for checking symbols, reviewing formulas, consulting probability tables, reinforcing concepts, and supporting your work across the entire statistics course.

Appendix 1 — Symbols and Notation (Cheat Sheet)

Symbols and Notation

A quick reference to the symbols used in this book.

SymbolMeaningExample
$$\Sigma$$Summation (add them up)$$\Sigma X = 2+4+6=12$$
$$\bar{X}$$Sample mean$$\bar{X} = \tfrac{12}{3} = 4$$
$$\mu$$Population mean“The true average of all scores”
$$s$$Sample standard deviationSpread of quiz scores
$$\sigma$$Population standard deviationSpread of SAT scores
$$df$$Degrees of freedom$$df = n-1 = 29$$ if $$n=30$$
$$t$$t-test statisticCompare two group means
$$F$$ANOVA statisticCompare 3+ group means
$$r$$Pearson correlationStrength of linear relationship
$$R^2$$Coefficient of determinationProportion of variance explained
$$\chi^2$$Chi-square statisticCompare observed vs. expected counts
$$p$$Probability value“p < 0.05” → significant result

Practice self-test quiz

In the space below, please find practice problems and self-test quizzes. For full access, please signup free.

Lesson 19 — Ethics in Data and AI

ethics statistics

Modern statistics and AI are powerful.
They analyze millions of records, make predictions, and even guide decisions.
But with this power come ethical responsibilities.


Bias in Algorithms

Algorithms learn from data.
If the data are biased, the algorithm may reproduce — or even amplify — the bias.

Example:

  • If past hiring data favored men, an AI trained on it may also favor men.

Lesson: Always ask, whose data are we using, and what history do they reflect?


Privacy and Data Use

Big data often comes from personal information: browsing, phones, sensors.
Students, patients, and citizens deserve protection.

  • Informed consent
  • Secure storage
  • Respect for anonymity

Transparency and Accountability

AI systems are sometimes black boxes.
Users may not know how a decision was made.

Ethical practice means:

  • Explaining decisions in plain language
  • Allowing appeals and corrections
  • Sharing responsibility between humans and machines

Example: Predictive Policing

  • Data show more arrests in certain neighborhoods
  • AI may predict more crime there → police may increase presence
  • Result: the cycle may reinforce itself

This shows why ethical reflection is essential.


Guiding Principles

  • Fairness: avoid discrimination
  • Privacy: protect individual rights
  • Transparency: explain decisions
  • Accountability: humans must remain responsible

Visuals

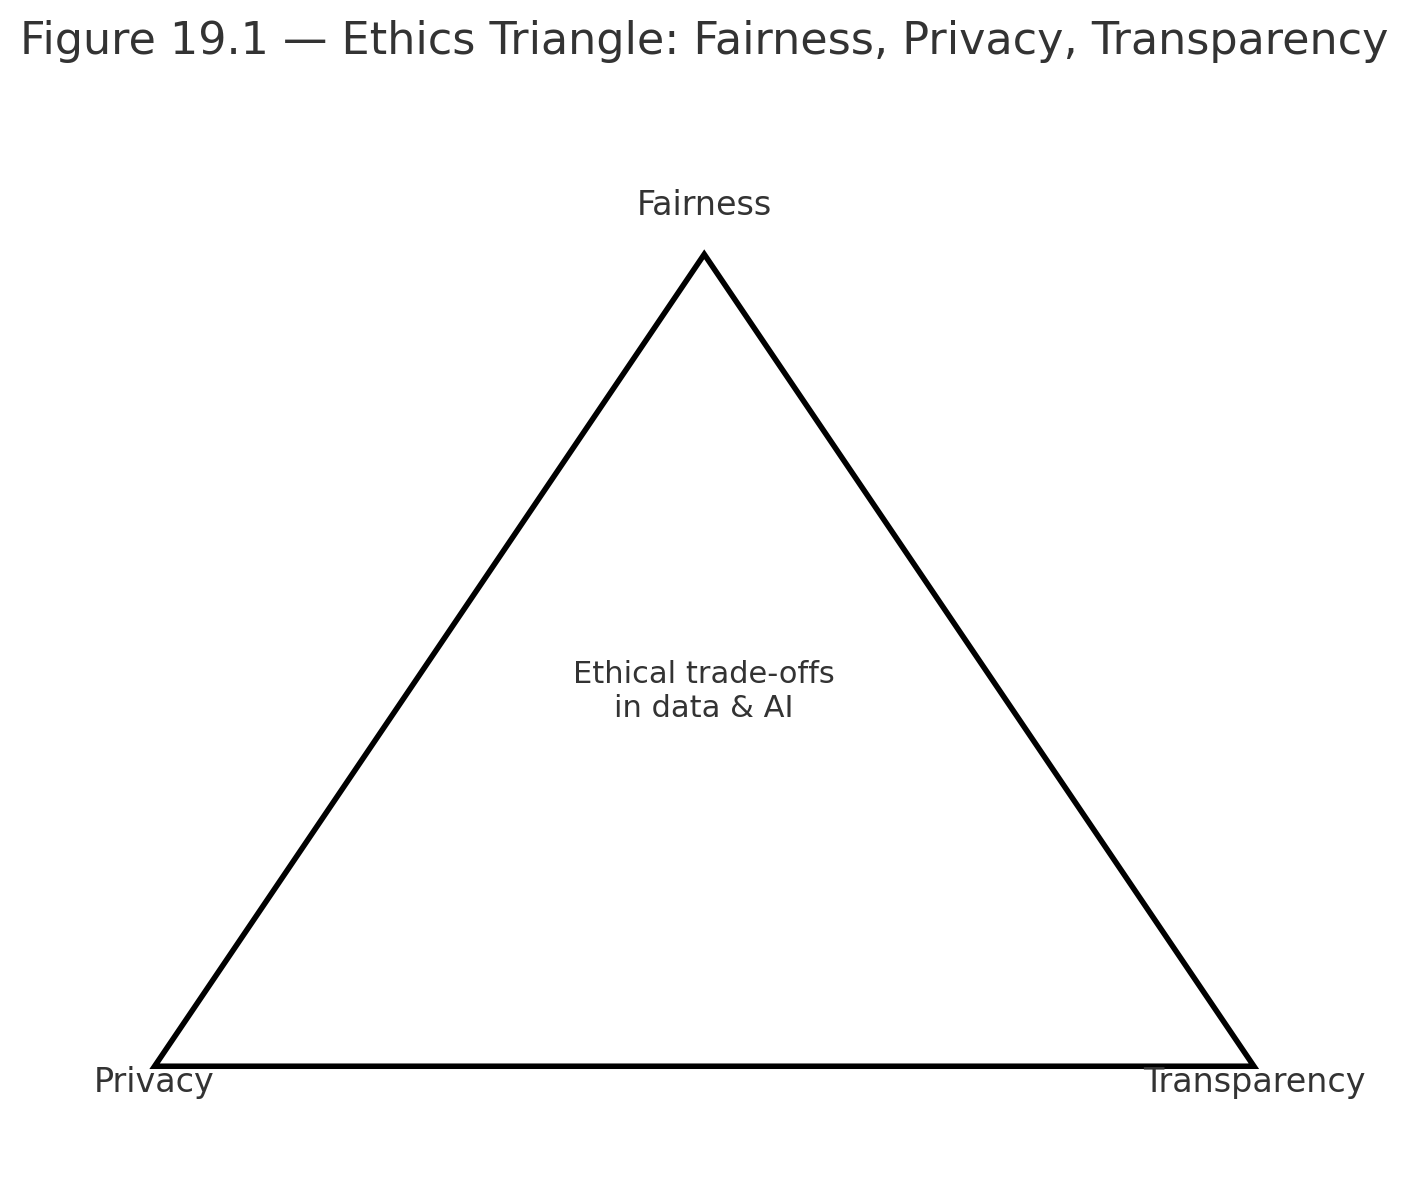
Figure 19.1 — Ethics Triangle: Fairness, Privacy, Transparency at the three corners.


Why This Matters

Statistics and AI are not only technical.
They are also social, cultural, and ethical.
Future scientists, teachers, and citizens must understand both the power and the responsibility of data.

Practice self-test quiz

In the space below, please find practice problems and self-test quizzes. For full access, please signup free.