Lesson 3 — Variance & Standard Deviation

variability around the mean

After finding the mean, the next question is: How much do the scores vary around that mean?
Variation tells us whether data are tightly clustered or widely spread. Two common measures are the variance and the standard deviation.


Variance and standard deviation - formal level

Variance and standard deviation - intuitive level

Variance

Variance is the average squared distance of each score from the mean.

Symbolic formula:
$$s^2 = \frac{\sum (X - \bar{X})^2}{n - 1}$$

Formula in words:
$$\text{Variance} = \frac{\text{sum of squared deviations from the mean}}{\text{number of scores} - 1}$$

Where:

  • $$s^2$$ = variance
  • $$X$$ = each score
  • $$\bar{X}$$ = mean
  • $$n$$ = number of scores

Example: Data: 6, 8, 10

  • Mean = 8
  • Deviations: (6–8) = –2, (8–8) = 0, (10–8) = 2
  • Squared deviations: 4, 0, 4
  • Sum = 8

Variance = $$\tfrac{8}{3-1} = 4$$


Standard Deviation

The standard deviation is the square root of the variance.

Symbolic formula:
$$s = \sqrt{\frac{\sum (X - \bar{X})^2}{n - 1}}$$

Formula in words:
$$\text{Standard deviation} = \sqrt{\frac{\text{sum of squared deviations from the mean}}{\text{number of scores} - 1}}$$

Example continued:
Variance = 4 → Standard deviation = $$\sqrt{4} = 2$$

So, on average, scores are about 2 units away from the mean.


Definition

  • Variance: average squared distance from the mean.
  • Standard Deviation: square root of variance; typical distance from the mean.

Visuals

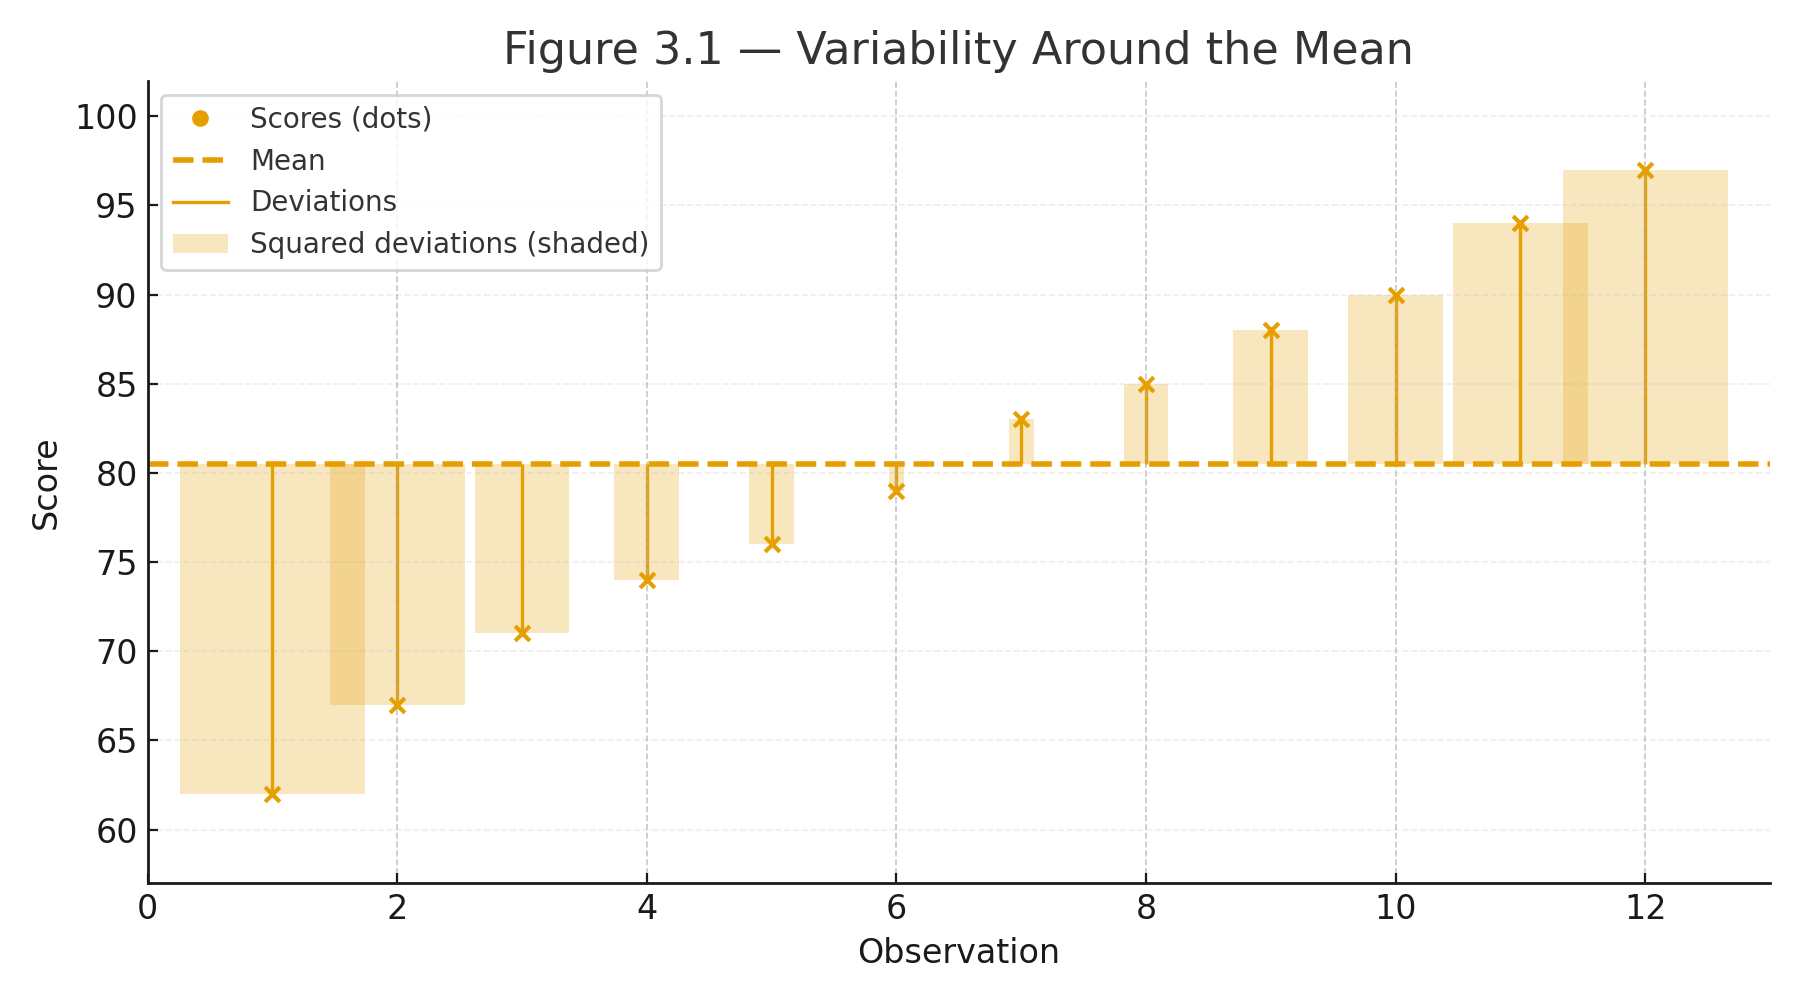
Figure 3.1 — Variability Around the Mean. A dot plot of scores with the mean marked, vertical lines showing deviations, and shaded boxes for squared deviations.


Why This Matters

Two sets of data can have the same mean but very different spreads.
Variance and standard deviation give us the language to describe that spread.
They are the foundation for most inferential tests in statistics.

Practice self-test quiz

In the space below, please find practice problems and self-test quizzes. For full access, please signup free.
Lesson 2 — The Averages

mean mode median

When we look at a set of numbers, the first question is: What is the typical value?
Statistics gives us three common answers — the mean, the median, and the mode.

Each describes “typical” in a different way.


The Mean

The mean is the arithmetic average — the balance point of the data.

Symbolic formula:
$$\bar{X} = \frac{\sum X}{n}$$

Formula in words:
$$\text{Mean} = \frac{\text{sum of scores}}{\text{number of scores}}$$

Where:

  • $$\bar{X}$$ = mean (X bar)
  • $$\sum X$$ = sum of all scores
  • $$n$$ = number of scores

Example: Scores: 10, 8, 7

$$\bar{X} = \frac{10 + 8 + 7}{3} = \frac{25}{3} = 8.33$$

So the mean is about 8.3.


The Median

The median is the middle value when the numbers are placed in order.

Steps:

  1. Arrange the scores from smallest to largest.
  2. If there are an odd number of scores, the median is the middle one.
  3. If there are an even number of scores, the median is the average of the two middle ones.

Examples:

  • Data: 5, 7, 9 → Median = 7
  • Data: 4, 6, 10, 12 → Median = (6 + 10)/2 = 8

The Mode

The mode is the most frequent score.

Example: Data: 2, 2, 4, 5, 5, 5, 7 → Mode = 5


Definition

  • Mean: arithmetic average; balance point.
  • Median: middle score; divides data in half.
  • Mode: most frequent score.

Visuals

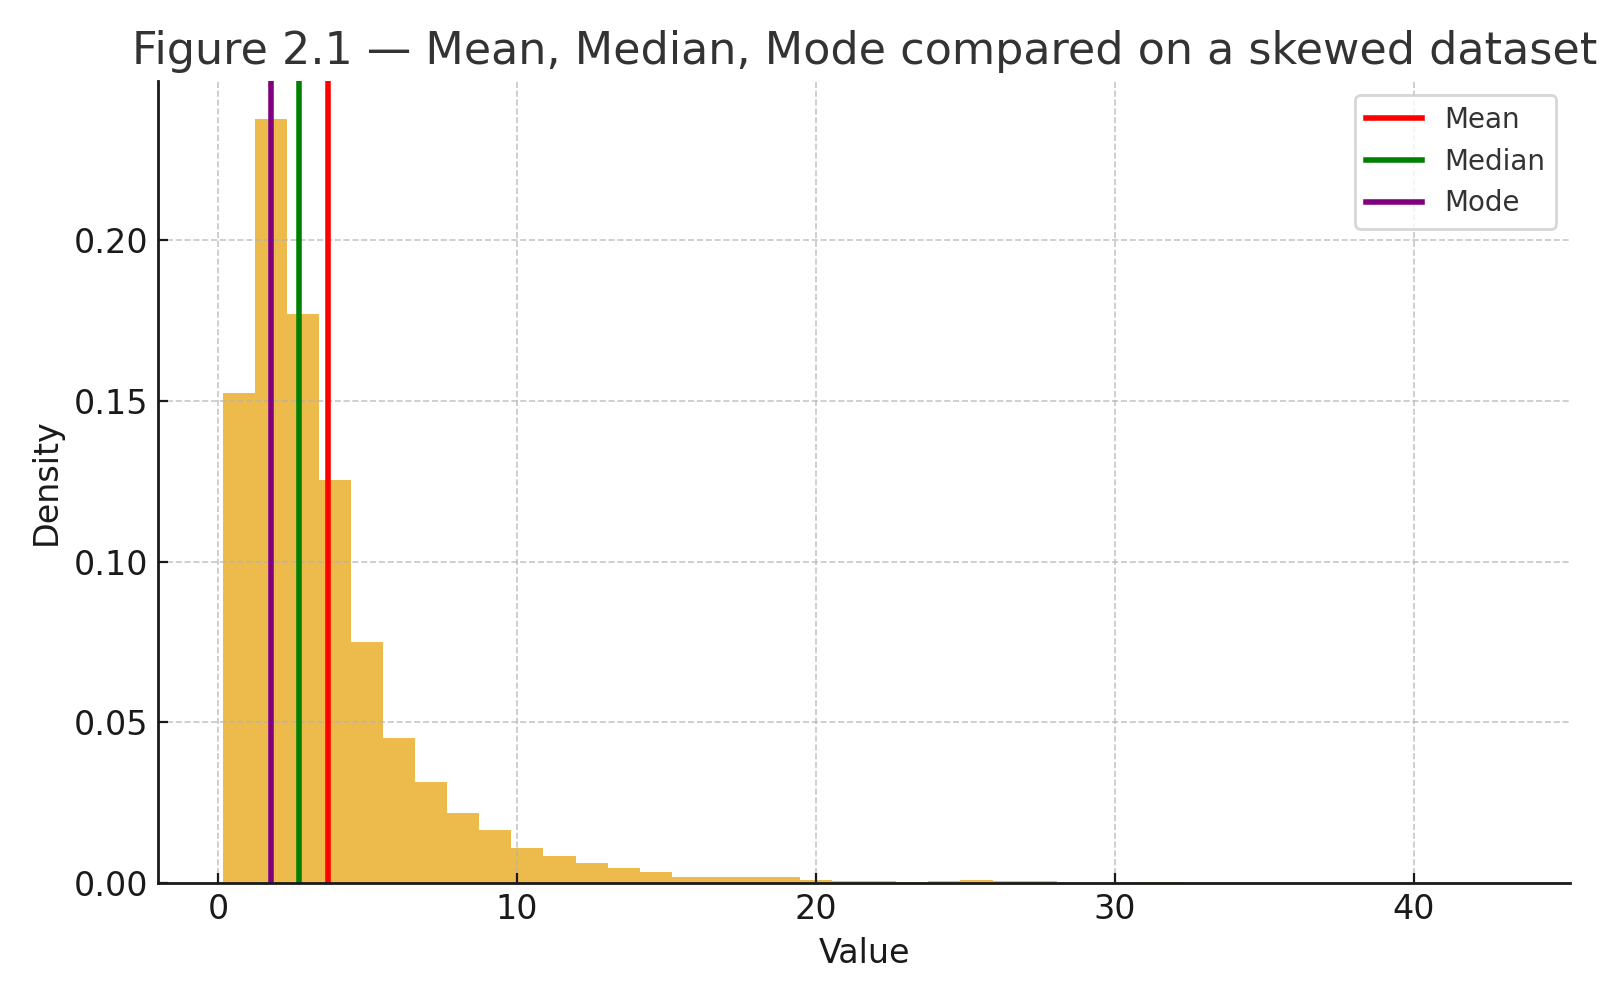
Histogram of a skewed dataset with vertical markers for the mean, median, and mode.
Figure 2.1 — Mean, Median, Mode compared on a skewed dataset. Histogram with three markers: red line = mean, green line = median, purple line = mode.

Why These Matter

  • The mean is sensitive to extreme values.
  • The median resists extremes and can better represent a “typical” score.
  • The mode is useful for categorical or count data.

Together, the three averages give us a rounded view of what is typical in a dataset.

Practice self-test quiz

In the space below, please find practice problems and self-test quizzes. For full access, please signup free.
Lesson 1: What Is Statistics? Why Does It Matter?

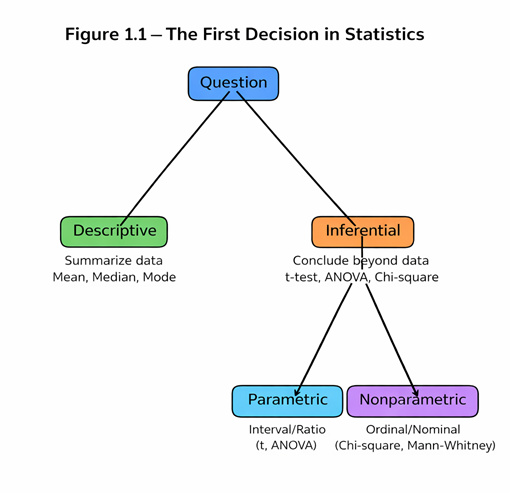
Flowchart illustrating the first decision in statistics: descriptive versus inferential methods, with inferential statistics divided into parametric and nonparametric analyses.es.


Statistics is the science of learning from data. It provides the tools to decide whether what we observe is real or accidental, and whether a difference is large enough to matter.

When a scientist runs an experiment, or when a pollster surveys a group of voters, the results always vary. Statistics gives us a way to interpret that variation and to draw conclusions.

The Two Branches of Statistics

  • Descriptive Statistics describe and summarize what we see.
    Example: “The average score on the math test was 78.”
  • Inferential Statistics use a sample to make conclusions about a larger group.
    Example: “Based on this sample, we estimate the average score for all students in the district.”

Definition:

  • Descriptive statistics = picture of the data.
  • Inferential statistics = prediction about the population.

Parametric vs. Non-parametric Statistics

There are two main families of tests:

  • Parametric tests (such as the t-test or ANOVA) assume certain conditions in the data, like normal distribution and interval/ratio measurement.
  • Non-parametric tests (such as Chi-square or Mann–Whitney) require fewer assumptions and are used when data are ranks (ordinal) or categories (nominal).

Simple rule of thumb:

  • If data are interval or ratio (e.g., test scores, heights), use parametric tests.
  • If data are ordinal or nominal (e.g., ranks, categories), use non-parametric tests.

First Formula in Statistics: The Mean

The mean is our first step toward summarizing data.

Symbolic formula:
$$\bar{X} = \frac{\sum X}{n}$$

Formula in words:
$$\text{Mean} = \frac{\text{sum of scores}}{\text{number of scores}}$$

Where:

  • $$\bar{X}$$ = mean (X bar)
  • $$\sum X$$ = sum of all scores
  • $$n$$ = number of scores

Example: Data: 6, 8, 10

$$\bar{X} = \frac{6 + 8 + 10}{3} = \frac{24}{3} = 8$$

So the mean is 8.

Visual

Flowchart showing descriptive and inferential statistics, with inferential methods divided into parametric and non-parametric analyses.
Figure 1.1 — The First Decision in Statistics. A flowchart: Descriptive vs. Inferential → Parametric vs. Non-parametric, with examples inside each box.

Why This Matters

Before you can choose the right statistical test, you must know:

  1. What kind of data you have (descriptive vs. inferential).
  2. How those data are measured (nominal, ordinal, interval, ratio).
  3. Which family of tests applies (parametric vs. non-parametric).

This chapter sets the stage. The rest of the book builds from here, using only a small set of simple formulas to unlock the logic of statistics.

Practice self-test quiz

In the space below, please find practice problems and self-test quizzes. For full access, please signup free.
Part 1 — Theory • Concepts • Statistical Tests

Welcome to Part 1 — Theory • Concepts • Statistical Tests of this free online statistics textbook. This foundational section is devoted to the formal concepts and core tools of statistical analysis. It introduces what statistics is, why it matters, and how statistical reasoning is expressed through definitions, measures, distributions, and test procedures.

The emphasis in Part 1 is conceptual and structural rather than experimental. Students learn how fundamental statistical quantities are defined, how variability is measured, and how classical statistical tests are constructed and interpreted. Topics such as descriptive statistics, the normal distribution, standard error, hypothesis testing, and degrees of freedom are developed as elements of a coherent theoretical framework.

Part 1 is designed to answer a central question: What statistical methods exist, and what do they mean? By focusing on formal ideas, canonical tests, and their logical foundations, this section provides the conceptual grounding required for AP Statistics and introductory college-level coursework. It establishes the vocabulary, assumptions, and inferential logic that later applications depend upon.

Lessons in Part 1: Theory • Concepts • Statistical Tests

  1. What Is Statistics? Why Does It Matter? – An introduction to statistical reasoning, data, variability, and the role of statistics in science and everyday life.
  2. The Averages – Understanding mean, median, and mode, including when each measure is most appropriate.
  3. Variance and Standard Deviation – Developing intuition for variability through visual reasoning and step-by-step calculations.
  4. The Standard Normal Curve – Exploring the properties of the normal distribution and standard scores.
  5. Standard Error of the Mean (SEM) – Understanding sampling variability and the logic of statistical inference.
  6. The t-test – Hypothesis testing for means, including assumptions, test statistics, and interpretation.
  7. Analysis of Variance (ANOVA) – Comparing multiple group means by partitioning variance.
  8. Post Hoc Tests – Identifying which groups differ after a significant ANOVA result.
  9. Correlation – Measuring the strength and direction of relationships between variables.
  10. Regression – Modeling relationships using linear regression and interpreting slope and intercept.
  11. Non-Parametric Tests – Statistical alternatives used when parametric assumptions are violated.
  12. Chi-Square Tests – Analyzing categorical data using goodness-of-fit and tests of independence.
  13. Degrees of Freedom Cookbook – A practical guide to determining degrees of freedom across common statistical tests.

High School Statistics: Concepts, Examples, and Interactive Exercises | Free Online Textbook

High School Statistics is an example-driven introduction to statistical thinking. It is written for students preparing for college who want clear explanations, readable math, and confidence with data. Throughout the book you will find short formulas (LaTeX rendered by MathJax), step-by-step examples, simple calculator or spreadsheet demonstrations, and  live interactive practice, self-test quiz — always optional and always focused on understanding.

Who this book is for

• High school and early college students in introductory statistics courses
• Students in psychology, biology, education, or social science who need to understand data
• Self-learners who prefer short explanations followed by examples and visuals

What you need to know first

• Basic Math (add, subtract, multiply, divide), handle fractions, use square roots)
• Comfort with graphs (axes, slope, upward/downward trends)
• No calculus required; symbols are introduced gently and explained as they appear

How this book is organized

The text is structured as a Book in Drupal with three levels: Parts → Lessons → (occasional) Sub-lessons.

Part 1 — Theory • Concepts • Statistical Tests
Core ideas of descriptive and inferential statistics: averages and variability, the normal curve, standard error, t-tests, ANOVA, correlation, regression, chi-square, and non-parametric tests.

Part 2 — Lecture & Lab
Short lectures and lab-style lessons that connect mathematics to intuition through stories, visuals, and examples.

Part 3 — Statistical Design
Design-oriented lessons where you decide which statistical test fits each scenario.

Part 4 — Applications (Cases and Examples)
Worked examples showing how to pose statistical questions, run tests, interpret results, and evaluate conclusions.

Part 5 — Statistical Tests (Cookbook Style)
A quick-reference guide summarizing major tests, their formulas, assumptions, and when-to-use rules.

Part 6 — Modern Statistics: Data, AI, and Machine Learning
Big data, resampling, simulation, regression beyond the line, machine learning fundamentals, neural networks, and ethics in data and AI.

Part 7 — The Storyteller Statistician
Short thematic essays linking statistical reasoning to everyday intuition, narrative, and real-life thinking.

Part 8 — Appendices
Symbols and notation, math review, statistical tables, technology tips (Excel, R, Python, iPhone calculator), datasets, study advice, glossary, and formula sheet — each paired with small QR codes linking to interactive tools.

How to use this book

• When available, review the short learning goals or introductory overview at the start of each lesson.
• Read the key ideas and follow the worked examples step by step.
• Many lessons include brief practice problems or self-test questions—use them to check your understanding as you go.
• When QR codes or links are provided, use them to open calculators, datasets, and optional quizzes or tools.
• Consult the Appendices whenever you need quick notation, math review, statistical tables, datasets, or formula sheets.

Notation and conventions

Notation is light and consistent. Symbols are paired with plain-language explanations.

Symbolic formula: $$\bar{X} = \frac{\sum X}{n}$$
Formula in words: Mean = sum of scores ÷ number of scores.

Symbolic formula:
$$s^2 = \frac{\sum (X - \bar{X})^2}{n - 1}$$

Formula in words:
$$\text{Variance} = \frac{\text{sum of squared deviations from the mean}}{\text{number of scores} - 1}$$

What you will be able to do

• Summarize and visualize data clearly
• Quantify uncertainty with standard errors and confidence intervals
• Test hypotheses using t-tests, ANOVA, and chi-square procedures
• Recognize relationships with correlation and regression
• Use simulation and modern tools to explore real data

Technology and reproducibility

Many applied sections include optional calculations using Google Sheets, Excel, R, or Python (Colab). A collection of small, clear practice datasets is provided for hands-on exploration. You may follow along with the code or perform the calculations by hand — statistical thinking, not software mastery, is the goal.

Practice and self-check

Many lessons conclude with a Practice self-test quiz section containing short problems you can use to check your understanding. Quizzes and review questions reinforce the main ideas, and the practice datasets are small, realistic, and chosen for clarity rather than complexity.

Accessibility

• Math is rendered with MathJax and designed for display on phones and tablets
• Many figures include descriptive alternative text for screen readers
• Core formulas are presented symbolically and accompanied by plain-language explanations

A note on ethics

Data reflect people. Treat them with care. Respect privacy, avoid bias, and be honest about uncertainty. Replication and transparency make statistics trustworthy.

How to get help

• Review the examples and practice sets in each chapter
• Check the Glossary and Appendices for notation and quick refreshers
• Ask questions — in class, online, or through your course forum

Thanks

Thank you to the students and teachers who used early versions of this text and shared feedback. Your questions led to clearer examples, better visuals, and more practical explanations. If you notice an error or have a suggestion, please send it through the contact form on the site.


Next Chapter

Practice self-test quiz

In the space below, please find practice problems and self-test quizzes. For full access, please signup free.