Reviews
In this section we publish reviews of this web site. Add yours here or in the Feedback section. We will post them here.
In this section we publish reviews of this web site. Add yours here or in the Feedback section. We will post them here.
Editorial disclosure: This commentary was generated by ChatGPT in response to a prompt supplied by the site author. It is not an independent review or institutional endorsement.
StatisticsTextbook.com is an unusually ambitious attempt to solve a persistent problem in statistics education: students are often taught how to perform statistical procedures before they understand what those procedures mean.
The site presents itself as an accessible statistics textbook for students preparing for college-level work, but its scope extends considerably beyond elementary statistics. It begins with fundamental concepts such as averages, variability, measurement, probability, the normal distribution, and standard error, and proceeds through hypothesis testing, t-tests, correlation, regression, chi-square, nonparametric statistics, and extensive treatments of analysis of variance.
It goes further still, introducing factorial designs, repeated-measures ANOVA, mixed designs, resampling and simulation, big data, machine learning, neural networks, and the ethics of data and artificial intelligence.
The principal strength of StatisticsTextbook.com is not simply the number of statistical topics it covers. Its more important contribution is the way the same statistical ideas are approached from several intellectual directions.
The resource combines formal textbook exposition with lectures and laboratory material, experimental design, worked applications, concise procedural references, modern data science, and narrative explanation.
This structure recognizes an important fact about learning statistics: understanding does not always arise from a single presentation.
A student who does not initially understand variance from an algebraic definition may understand it from a graphical representation. A student who can calculate a t-statistic may still not understand when a t-test should be used. A student who memorizes the definition of an interaction may understand it much more deeply after examining a factorial experiment.
StatisticsTextbook.com therefore provides several routes toward the same underlying statistical concepts.
Another strength is the treatment of mathematical notation. Formulas are retained rather than eliminated, but the notation is consistently connected to ordinary language and conceptual explanation.
This is an important pedagogical choice.
Statistics cannot be taught seriously by avoiding mathematics altogether. At the same time, mathematical notation should not become an unnecessary barrier between the student and the statistical idea being represented.
The site generally keeps the mathematics subordinate to statistical meaning. The objective is not merely to teach students to manipulate symbols, but to understand what those symbols represent.
The treatment of experimental design is particularly valuable.
Many introductory statistics courses are organized primarily as sequences of procedures: first a t-test, then ANOVA, then correlation, regression, and other techniques. Actual scientific investigation does not begin with a statistical test. It begins with a question, variables, observations, hypotheses, and an experimental or observational design.
The investigator must then determine which statistical analysis follows logically from that design.
By treating variables, measurement scales, experimental and observational designs, sample size, test selection, and common design errors explicitly, StatisticsTextbook.com shifts attention from the mechanical question:
“How do I calculate this statistic?”
toward the scientifically more important question:
“What statistical analysis does this problem justify?”
That distinction marks the transition from statistical calculation to statistical reasoning.
The site's treatment of analysis of variance deserves special mention.
Many elementary resources give limited coverage beyond one-way ANOVA. StatisticsTextbook.com proceeds into factorial designs, repeated-measures designs, interactions, and mixed or split-plot designs.
This matters because real experimental research frequently involves more than one independent variable, repeated observations from the same subjects, or combinations of between-subjects and within-subjects factors.
Introducing these designs gives students an early view of the logic of genuine experimental research rather than restricting statistics to artificially simple examples.
For students interested in psychology, biology, medicine, behavioral science, and other empirical disciplines, this is especially useful preparation.
One of the more unusual components of the site is The Storyteller Statistician.
Here, concepts such as measurement scales, variance, probability, the normal distribution, t-tests, ANOVA, repeated measures, and mixed designs are approached through narrative situations and concrete examples.
This method is not a substitute for formal statistical exposition, nor should it be. Its purpose is different.
Narrative examples can establish an intuitive conceptual structure before the student confronts the abstraction of formal notation. Once that structure exists, equations and statistical procedures have something meaningful to describe.
The result is a useful complement to the conventional textbook chapter.
StatisticsTextbook.com also recognizes that contemporary students encounter terms such as big data, machine learning, neural networks, and artificial intelligence increasingly early in their education.
Instead of presenting these subjects as disconnected technologies, the site places them within the broader development of statistical reasoning.
This is pedagogically sound. Machine learning may become easier to understand when the learner already understands such concepts as variability, prediction, sampling, regression, error, model fitting, and inference.
The inclusion of resampling, simulation, machine learning, neural networks, and ethical questions therefore extends the traditional statistics curriculum without abandoning its foundations.
The central educational challenge confronted by StatisticsTextbook.com is difficult: how can serious statistical ideas be made accessible without making statistics itself intellectually trivial?
The site largely succeeds because accessibility is achieved through explanation, repetition, examples, graphical interpretation, narrative, and multiple modes of presentation rather than simply by removing difficult material.
There are inevitable limits. A student seeking a proof-oriented course in mathematical statistics will require a different text. Advanced subjects such as mixed ANOVA, machine learning, and neural networks necessarily receive more introductory treatment than they would in a specialist university course.
Nor should beginning students assume that every section must be mastered sequentially. The site's modular structure is one of its advantages: more advanced material can be encountered when the learner is ready for it.
At its best, StatisticsTextbook.com presents statistics not as a catalogue of formulas and not merely as a collection of software procedures, but as a disciplined method of reasoning from observations under conditions of variability and uncertainty.
Calculation remains necessary, but calculation is placed within the broader questions of measurement, experimental design, probability, inference, interpretation, evidence, and scientific judgment.
For a high-school student preparing for scientific study, an early-college student encountering statistics for the first time, a self-directed learner, or an instructor seeking alternative explanations and worked examples, StatisticsTextbook.com offers a substantial introductory treatment.
Its distinctive contribution is the provision of multiple paths toward understanding the logic of statistical inference.
That is the site's principal educational achievement.
Reviewed August 2026
ChatGPT, OpenAI
```
Editorial disclosure: This commentary was generated by Grok in response to a prompt supplied by the site author. It is not an independent review or institutional endorsement.
I took a closer look at https://statisticstextbook.com/ and what makes it distinctive is how it blends old-school clarity with surprisingly modern topics.
Some free statistics resources remain basic, while others emphasize heavier mathematics. This one keeps the language simple — no calculus needed — while still covering t-tests, ANOVA, regression, and chi-square in a very example-heavy way. But then it goes further with a whole section on modern statistics: big data, resampling, simulation, machine learning basics, neural networks, and even data ethics. This extends the scope beyond conventional high-school topics.
The author, Dr. Michael Nikoletseas, brings an interdisciplinary background in neuroscience, philosophy of science, and math, which shows in the emphasis on real understanding rather than just formulas. The site is clean, designed for use on phones and tablets, uses nice visuals, and includes optional interactive quizzes (some need a free signup).
It's not flashy, but it's a free statistics site designed to prepare students for traditional classes and today's data-driven world.
Solid find.
— Grok
Editorial disclosure: This commentary was generated by Google Gemini in response to a prompt supplied by the site author. It is not an independent review or institutional endorsement.
In this story we will develop the concept of mixed designs and give a practice example.
Elegant research avoids complex
designs also called split-plot designs
or mixed designs. However, you may not
be spared of these monsters in your
student or research life.
Let’s get a whiff of these monsters.
A psychiatrist wanted to see, if two
new drugs improve the condition
of depressive and schizophrenic
patients.
He randomly assigned 4
depressive patients to Drug1 and
Drug2 conditions. That is, each of
the depressive patients will be
serving as a subject in both the
Drug conditions. This is a repeated
measures design.
He did the same with the
schizophrenic patients. He
randomly assign 4 schizophrenic
patients to Drug1 and Drug2
conditions. That is, each of the
schizophrenic patients will be
serving as a subject in both the
Drug conditions. This is a repeated
measures design.
As you see, here we have two
independent groups (depressive
patients, and schizophrenic
patients) but each patient is given
two treatments, that is he is tested
repeatedly, i.e., in both drug
conditions. We have a hybrid
situation, you would say. Both
independence and non-
independence in the same
experiment.
Here is the layout; X stands for scores.
The analysis of data in complex
designs like the above, is, as
always, an operation involving the
calculation of variance. The
interpretation of the results of such
an analysis is like the interpretations
we considered in this book so far.
ANOVA mixed split plot - formula and practice example
What is ANOVA mixed split plot design
ANOVA mixed split plot designs are complex designs that employ both independent and repeated measures. The best way to explain this is to present the layout of these experimental designs.
TABLE SHOWING THE LAYOUT
OF MIXED SPLIT-PLOT DESIGNS
Observe that there are two independent groups, depressive, and schizophrenic. Also observe that each subject of the depressive and schizophrenic groups is repeatedly tested, once with Drug 1, and later with Drug 2. This is a repeated measures arrangement So here we have a design in which independent and repeated measures are mixed. The name split plot comes from the fact that this design is extensively used in agricultural research.
ANOVA mixed split plot designs formula
As in all ANOVA, the formula for these designs is:
We read this as follows: Mean square between over mean square within. What is mean square, you ask? It is the mean of squares. What is squares, you ask. Squares is the statistical term for squared deviations (of squared differences) of each score X from the mean. What are the squared differences, you ask. Remember the formula for variance?
Look at the numerator
These are the squared differences summed. To complete our reasoning, we go back to where we started, the F formula, or F ratio, the formula for ANOVA. Why mean sums of squares? Simple because like all averages, we divide each sum of squares by its degrees of freedom. If you are observant, you will notice that the F formula is a modified t formula.
FORMAT OF ANOVA MIXED SPIT PLOT SUMMARY TABLE
HOW TO CALCULATE df OF ANOVA MIXED SPIT PLOT SUMMARY TABLE
ANOVA mixed split plot- practice examples
ANOVA mixed split plot- practice example 1
An experimenter wanted to test drugs (factor A), Drug 1 (A1) and Drug 2 (A2) for their effect on serotonin level in the blood of patients (factor B) suffering from depression (B1) and schizophrenia (B2) . He randomly selected six patients suffering from depression and gave them Drug 1. He waited for one hour and then he measured the level of serotonin in nanograms per liter (ng/lt) of each subject. He recorded the data. One week later he gave these subjects Drug 2. He waited for one hour and measured the level of serotonin of each subject. He also randomly selected six patients suffering from schizophrenia and repeated the same experiment that he performed with the depressive patients. The data are presented in the table below.
ANOVA MIXED SPIT PLOT SUMMARY TABLE
We have already developed the
concept of independence. In those
experiments in which each subject
is used only in one group or
condition, we say that the groups
are independent. So far in this
book we have considered only
independent-groups statistical
designs and experiments.
In designs in which the groups are
not independent, a subject is used
in more than one group or treatment.
That is, each subject experiences
more than one treatment.
For example, John may first be
given behavioral therapy, and
later, several months later, he may
also be given psychoanalytic
therapy. The effects of the two
therapies are then compared.
A variation of this arrangement is
to match each subject with
another subject on the basis of
similarity in some measure. This is
done to eliminate carryover effects
that may, obviously, be present in
giving one subject both treatments.
There are obviously advantages
and disadvantages in choosing
matched groups designs over
independent groups designs.
However, this issue is beyond the
goals of the present book. In
general, independent groups
designs are safer, and should, in
my opinion, be preferred.
The concepts in matched groups
designs are the same as those in
independent groups designs. We
will, therefore, confine ourselves to
giving examples of these designs.
First an example for t-test, and
then an example for ANOVA
repeated measures.
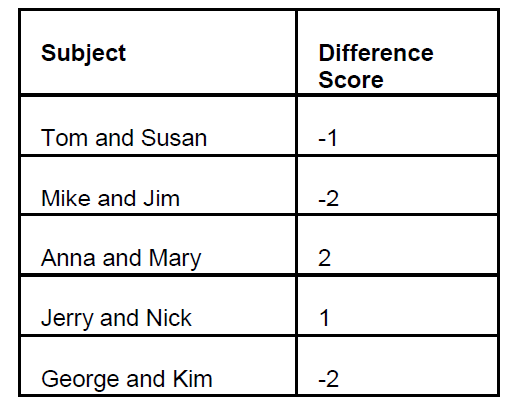
An example of t-test for
matched groups
In comparing two new anti-anxiety
drugs, a pharmaceutical company
selected 5 pairs of patients, each
pair matched on the basis of their
anxiety score.
Here is the layout and data of the
experiment.
Mean for difference=0.4
The formula for the t-test for
dependent groups is
We read it as follows:
t for paired observations equals
mean of differences divided by the
standard deviation over the square
root of the n. (The standard
deviation divided by the square
root of the n is the standard error
of the mean, SEM, remember?)
You know all of the terms of the
t-formula. You also recognize that it
is the same old story, our old
friend, the z formula.
t=+0.49 df=4
Entering the t-table with df 4 for a two-tailed 0.05 test, we
find that the required |t|=2.776
Our obtained t 0.49 is smaller
than the required, therefore we do
not have significance. We say that
the difference we observed is not
significant (p>0.05).
Study the table below..
It adds to our effort toward integration
and understanding beyond a mechanistic
use of a plethora of formulas.
Study the table below..
It adds to our effort toward integration
and understanding beyond a mechanistic
use of a plethora of formulas.
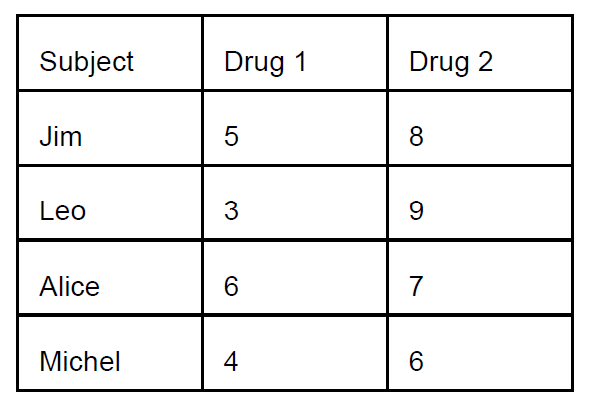
Example of ANOVA Repeated
Measures
Four patients with damage in the
hippocampus were treated with
two new drugs in order to see if
their memory improved.
Here is the layout as well as the
scores of the experiment. High
scores indicate improvement in
memory.
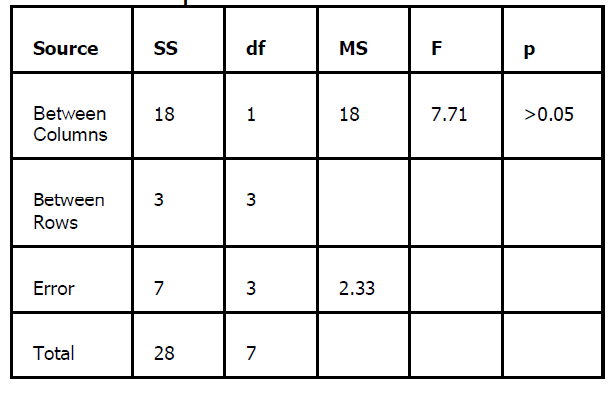
ANOVA SUMMARY TABLE
Repeated Measures
Entering the F table in Appendix
with df 1 and 3, we find an F of
10.12. This is the required F in
order to have significance. Our
obtained F (see ANOVA summary
table above) is 7.71. It is less than
the required F, therefore, we do
not have significance. We say:
There was no significant difference
between the means of the two
conditions (p>0.05).
P greater than point o five.
I see there are questions.
What is Between Columns? You ask.
It is the usual Between variance
that you know. The variance that
our treatments produce. The
variance of the means.
What is Between Rows? you ask.
If you look at the layout above,
you see that the rows are subjects,
one subject per row. The mean of
each subject is the mean of each
row. The variance of these means
are the variance between the
rows.
Why you did not calculate an F for
the Rows? you ask.
There is no reason that I can think
of, that would justify my wanting to
know whether there is a statistical
significant difference between
subjects. That would be an
absurd statement.
Once again you see that our
conceptual approach allowed us to
attack this design too, without the
need for new formulas. What is of
course more important is the fact
that we understand the logic of this
design too. We feel in command,
comfortable to handle any issue.