


Tables give the critical values we compare our test statistic against.
They depend on:
- The significance level (α, often 0.05)
- The degrees of freedom (df)
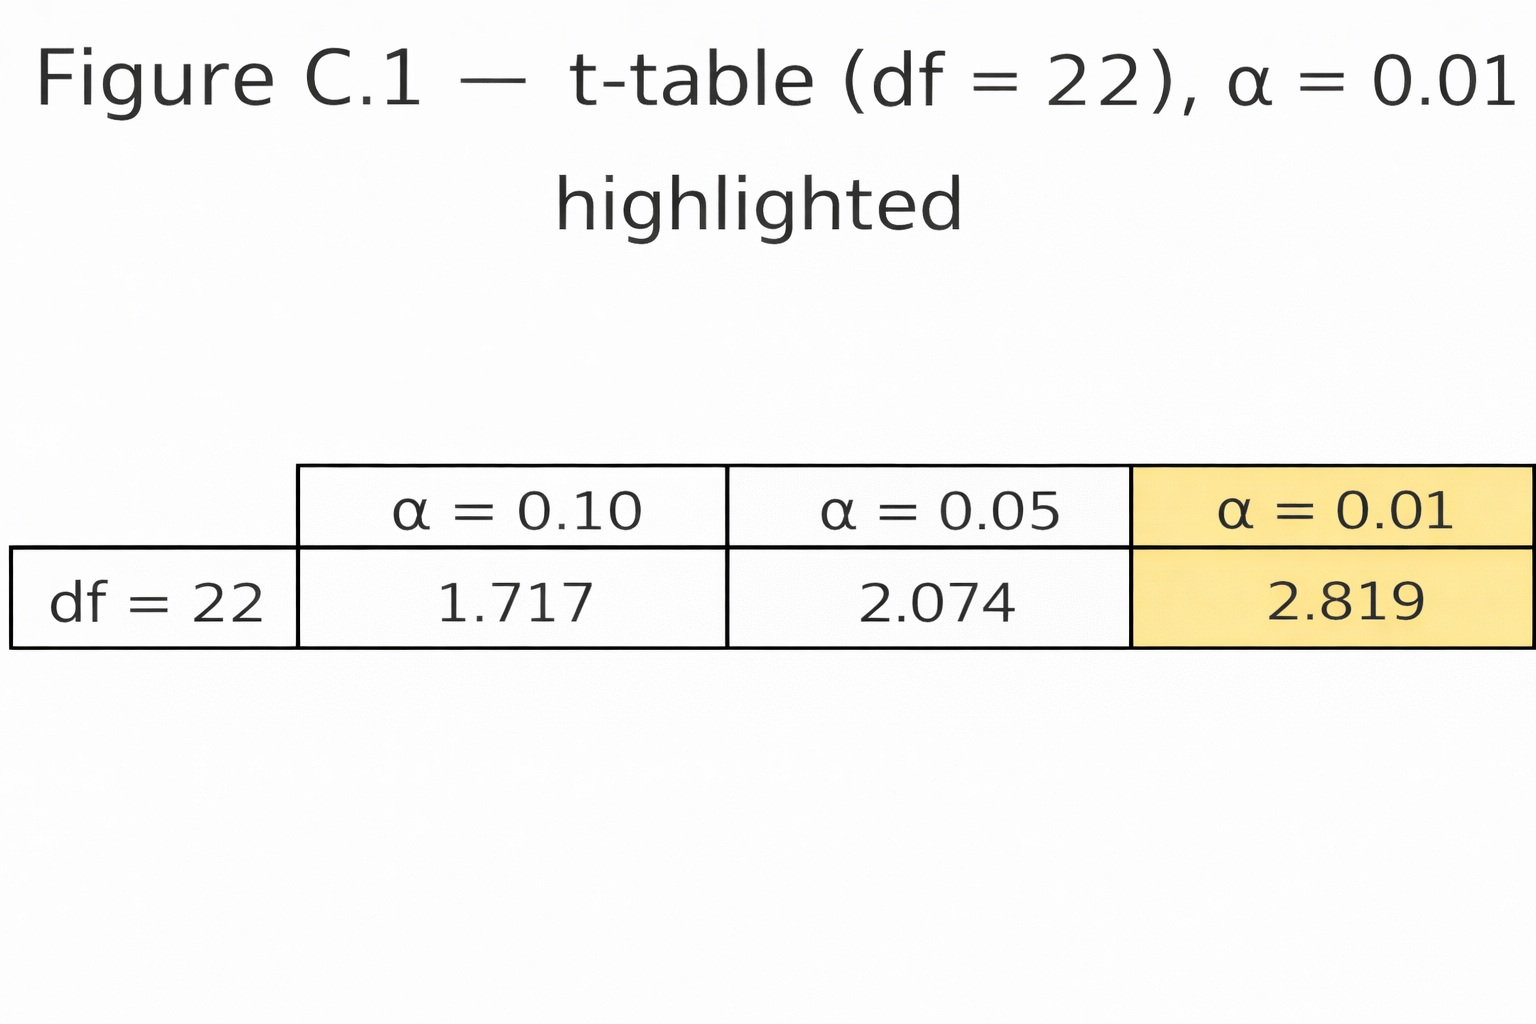
t-table
- Rows = degrees of freedom (df)
- Columns = significance level (α)
Example:
- Independent-samples t-test with n₁ = 12, n₂ = 12
- df = 12 + 12 – 2 = 22
- At α = 0.05 (two-tailed) → critical t ≈ 2.07
- If $$|t| \geq 2.07$$ → significant
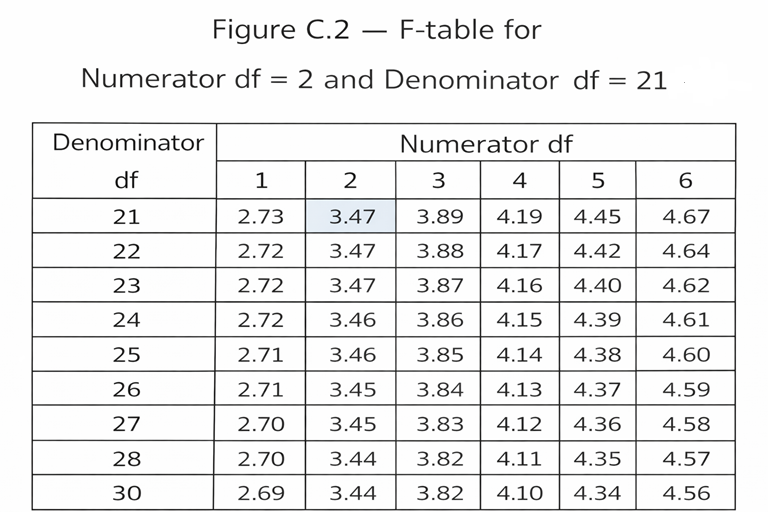
F-table
- Needs two df values:
- df between (numerator)
- df within (denominator)
Example:
- One-way ANOVA, 3 groups, N = 24
- df between = k – 1 = 2
- df within = N – k = 21
- At α = 0.05 → critical F ≈ 3.47
- If computed F ≥ 3.47 → significant
Student Tips
- Always compute df correctly.
- Use tables if no software is available.
- Most calculators or apps today give exact p-values — faster than tables.
📱 QR: Interactive critical value calculator (t and F tables online)
Visuals
Figure C.1 — Snippet of a t-table row (df = 22, α = 0.05 highlighted).
Figure C.2 — F-table grid with numerator df = 2, denominator df = 21 marked.
Practice self-test quiz
In the space below, please find practice problems and self-test quizzes. For full access, please signup free.